About me
Hello! I’m Lakshmi Kant, and I'm
Experienced professional with 4+ years in SEO, Data Science and Analytics, including 3+ years as an Associate Data Scientist and Data Analyst. Skilled in extracting insights from real-world data to drive strategic decisions. also, familiar with designing and implementing models, algorithms, and statistical analysis to solve specific business problems and developing predictive models.
In the world of technology, I am passionate about working with the most transformative technologies of our time, such as Artificial Intelligence (AI), Machine Learning (ML), Cloud Computing, Internet of Things (IoT), Cyber Security, Automotive, and Robotics.

Experience
4+ years;
Data Science & Analytics | SEO

Education
B. Tech in Mechanical Engg.;
I. Sc (12th) in Mathematics

My Services
Motto:- "Data Science | Data Analytics | SEO | R&D | Digital📈Data📊AI🎯"
I provide data-driven insights to optimize strategies, enhance online visibility, and integrate advanced machine learning solutions. Whether improving search rankings or leveraging analytics for deeper insights, and tailored solutions for impactful decisions. With a focus on scalability and efficiency, I ensure timely delivery of real-time schemas, enabling swift adaptation to market trends.
My expertise in predictive analytics and personalized marketing helps maximize ROI and drive sustainable growth.


My Skills
With 4+ years of experience in the field, I have developed a solid foundation in data analysis, data visualization, statistical analysis, predictive analytics and SEO analysis. I am adept at transforming raw data into actionable insights, generating reports, and presenting findings to both technical and non-technical stakeholders. I am a quick learner and specialize in multitude of skills required for SEO, Data Science and Analytics.
Programming Languages
- SQL
- Python
- R
Data Visualization
- Microsoft Power BI
- Tableau
- Looker Studio
- Zoho Analytics
- IBM Cognos Analytics
Data Analysis
- Data Modeling
- Data Mining
- Statistical Analysis
- Critical Thinking
- Problem Solving
Python Libraries
- Pandas
- NumPy
- Matplotlib & Seaborn
- Scikit-learn
- Statsmodels
- BeautifulSoup
- SciPy
Tools & Software
- MS Excel
- MySQL Workbench
- VS Code
- RStudio
- Jupyter Notebook
- Anaconda Navigator
- MS Access
- Google Analytics
Machine Learning
- ML Algorithms
- Data Preprocessing
- Feature Engineering
- Model Evaluation
- Ensemble Methods
Portfolio
Here is some of work to put my skills into practice and I've learned a lot throughout this process. Explore my projects by clicking based on skills and industries from the navigation below to find tailored insights.
- Data
- MS Excel
- SQL
- MS PowerBI
- Tableau
- Python
- R Programming
- Statistics
- Machine Learning
- NLP |
- Automotive
- BFSI
- Retail
- E-commerce
- Human Resource
- Logistics and Supply Chain
- Healthcare
- Research Services
- Wellness and Fitness
- Fictional and Bike-share

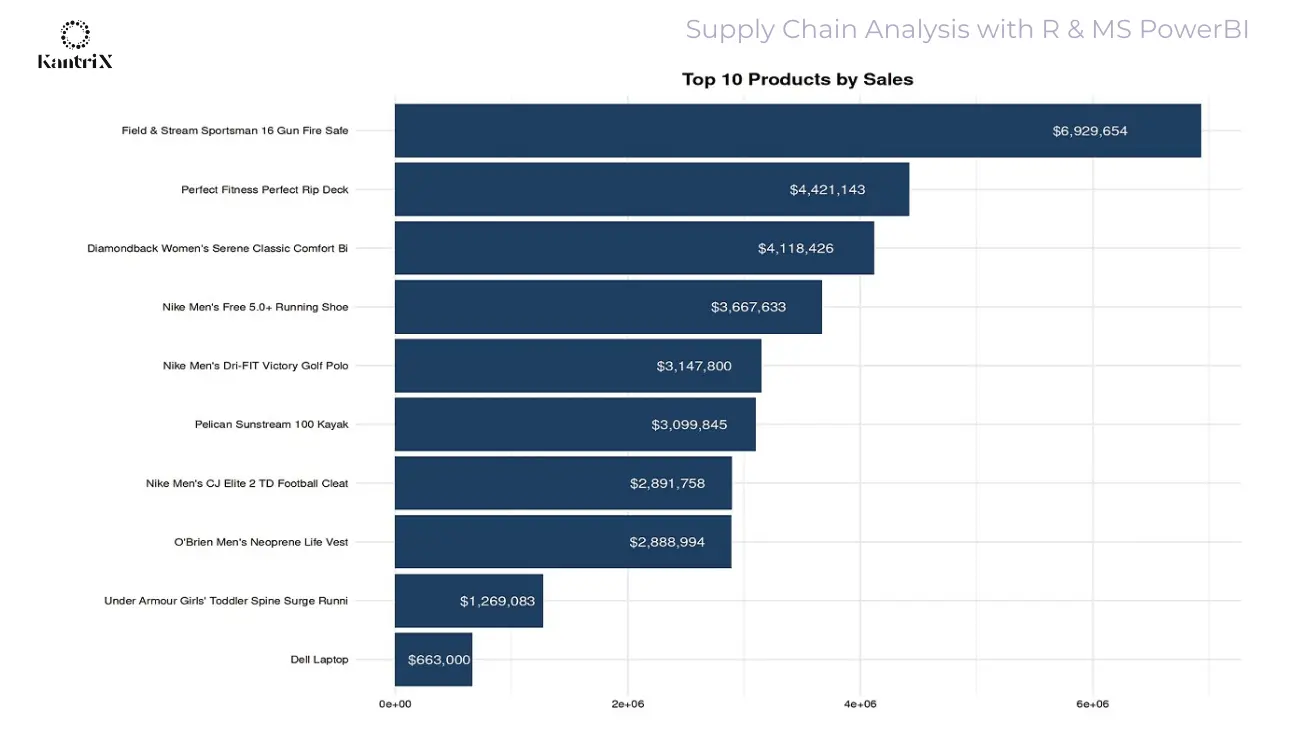
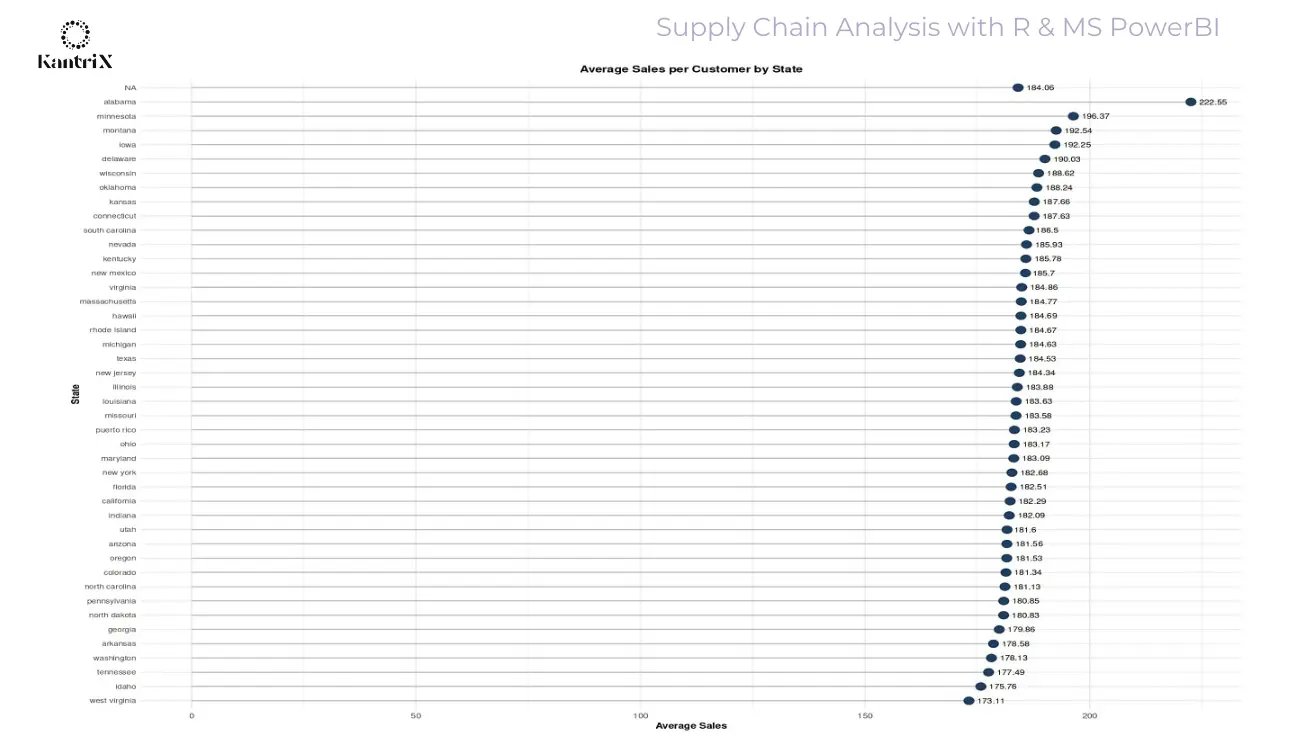
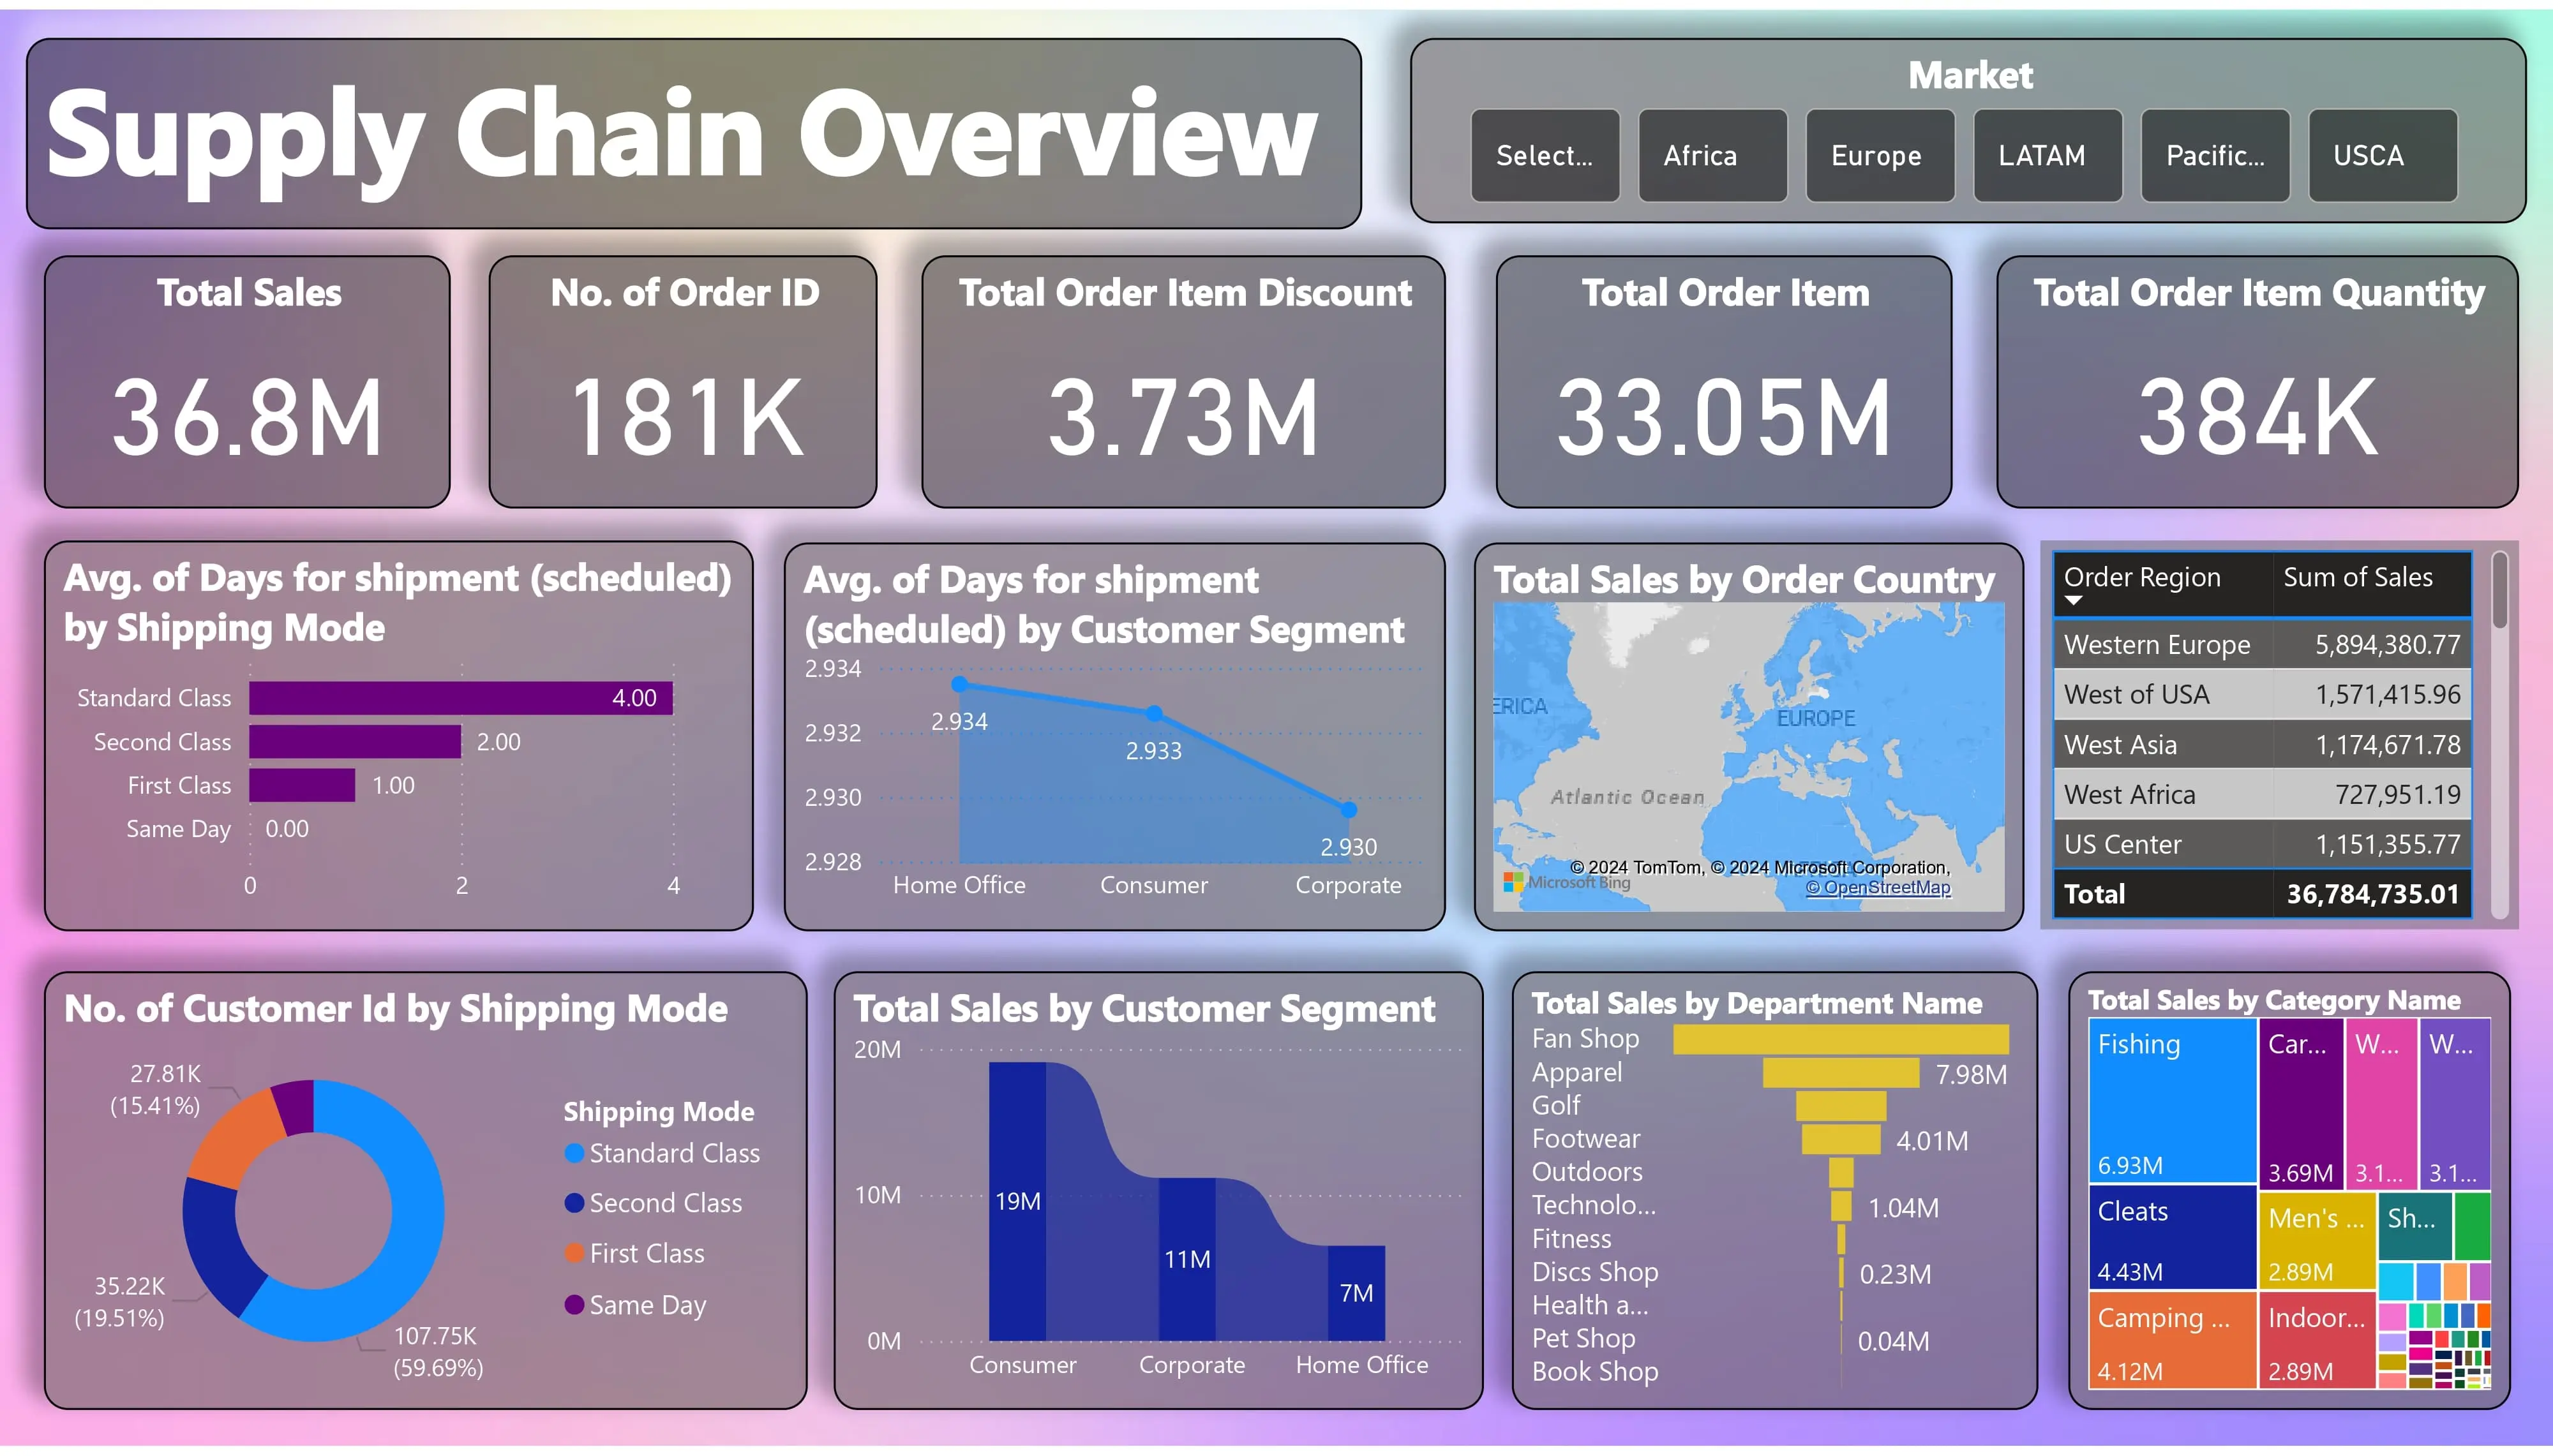
Supply Chain Analysis with R Programming and MS PowerBI
In this project, Conducted a supply chain analysis using R and MS PowerBI to optimize logistics and streamline operations. Tasks included data cleaning, visualization, and exploratory analysis to uncover cost-saving opportunities, demand patterns, and inefficiencies. Delivered actionable insights to improve efficiency and decision-making.
Supply Chain Analysis with R and MS PowerBI
Business Domain: Logistics and Supply Chain
Performed a comprehensive supply chain analysis using R and MS Power BI, focusing on optimizing logistics and streamlining operations. Key tasks included data cleaning, visualization, and exploratory analysis to identify cost-saving opportunities, demand trends, and inefficiencies. Provided actionable insights to enhance operational efficiency and informed decision-making.
View Project:  GitHub
 MS PowerBI
 Kaggle
 Linkedin
Tools Used:
 MS PowerBI |
 plotly
Project Details:
Insights and Key Metrics:-
Sales Insights
-
Regional Performance:
-
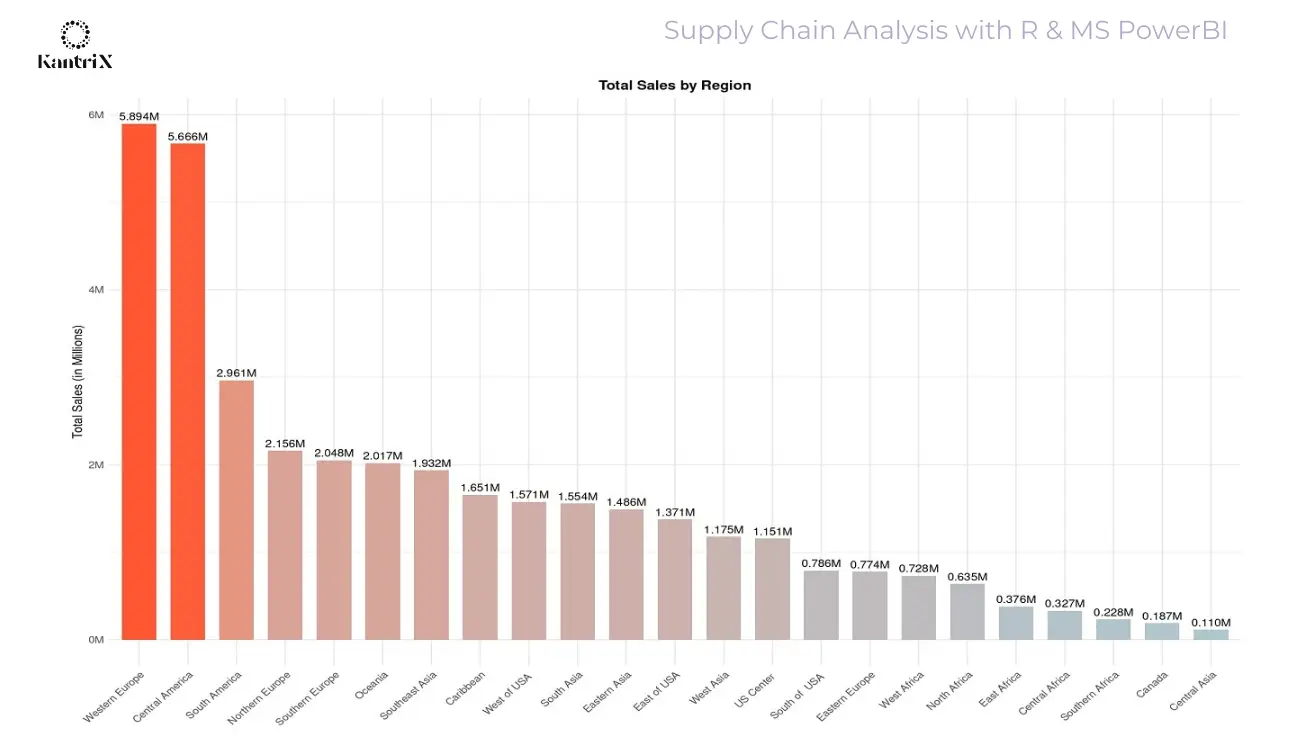
Western Europe dominates sales with $5.89M, followed by West USA ($1.57M) and West Asia ($1.17M).
-
West Africa and US Center show significantly lower sales, indicating opportunities for improvement in these regions.
-
Customer Segments:
-
The Consumer Segment is the largest contributor to sales, accounting for ~$19M, followed by Corporate ($11M) and Home Office ($7M).
-
Top Product Categories:
-
Fan Shop and Apparel are the most profitable categories, generating $7.98M and $4.01M in sales, respectively.
-
Niche categories like Health Accessories and Book Shop contribute marginally to overall sales, highlighting areas for potential growth.
Shipping Insights
-
Shipping Modes:
-
Standard Class is the most utilized shipping mode, preferred by ~60% of customers, but it has the longest delivery time (avg. ~4 days).
-
First Class and Same Day shipments are faster but less frequently used (~20% and ~15% of customers, respectively).
-
Shipping by Customer Segments:
-
The Corporate Segment experiences the fastest shipping time (avg. 2.93 days), while Consumers face slightly higher delays.
Order and Discount Trends
-
Order Volume:
-
Total order quantity reached 384K, with an average discount of 3.73M applied across all items.
-
Market-Specific Observations:
-
Markets like Africa and LATAM might require more promotional strategies to drive orders and improve their relatively low contributions.
Key Metrics
-
Sales Performance: Total sales amounted to $36.8M, driven by 181K orders and 33.05M items sold. The Consumer Segment was the largest contributor to revenue.
-
Regional Highlights: Western Europe emerged as the top-performing region, generating $5.89M in sales. Other regions like West USA and West Asia followed at a distance.
-
Shipping Insights: The Standard Class shipping mode is the most preferred, accounting for 59.69% of all shipments. However, Same Day shipping offers the fastest delivery, with no delays reported.
Conclusions:-
-
Consumer-driven Market: The Consumer Segment plays a crucial role in driving revenue, making it the most valuable customer segment to retain and grow.
-
Shipping Delays and Preferences:
-
The high usage of Standard Class despite delays indicates cost-sensitivity among customers.
-
Faster shipping modes like Same Day and First Class could be leveraged to attract premium customers.
-
Regional Disparities:
-
While Western Europe and West USA excel, markets like West Africa and US Center need strategic interventions to boost performance.
-
Category Focus:
-
Categories like Fan Shop and Apparel are key revenue drivers, whereas lower-performing categories such as Health Accessories may require better marketing or product optimization.
Recommendations:-
-
Consumer-driven Market:
-
Focus on West Africa and US Center with targeted promotions and localized strategies to tap into untapped potential.
-
Enhance product availability and marketing in regions like LATAM and Africa to improve their contribution.
-
Customer Segment Targeting:
-
Offer exclusive discounts and personalized offers for the Consumer Segment to maintain their engagement and loyalty.
-
Explore opportunities to grow the Home Office Segment by creating customized solutions or bundles tailored to their needs.
-
Shipping Optimization:
-
Improve delivery times for Standard Class through better logistics management to retain cost-conscious customers.
-
Promote faster shipping options (e.g., Same Day) by offering them at discounted rates for high-value orders to attract premium customers.
-
Product Category Optimization:
-
Invest in marketing campaigns for high-performing categories like Fan Shop and Apparel to sustain their growth.
-
Revamp or reposition niche categories like Health Accessories to improve their sales.
-
Discount and Promotion Strategy:
-
Analyze the impact of discounts on sales to ensure profitability while maintaining customer satisfaction.
-
Conduct A/B testing for promotional campaigns to identify the most effective strategies for various markets and segments.
-
Advanced Analytics:
-
Perform deeper analysis on time-based trends to identify sales seasonality and align supply chain operations accordingly.
-
Use predictive models to optimize inventory levels based on customer behavior, regional demand, and shipping patterns.
Connect & Follow:
If you found my project insightful, I’d love to connect! I’m passionate about creating impactful data-driven solutions like this one to drive success. Follow me for more updates on my projects and insights. Let’s collaborate and grow together!
Data Scientist | Data Analyst | SEO Analyst

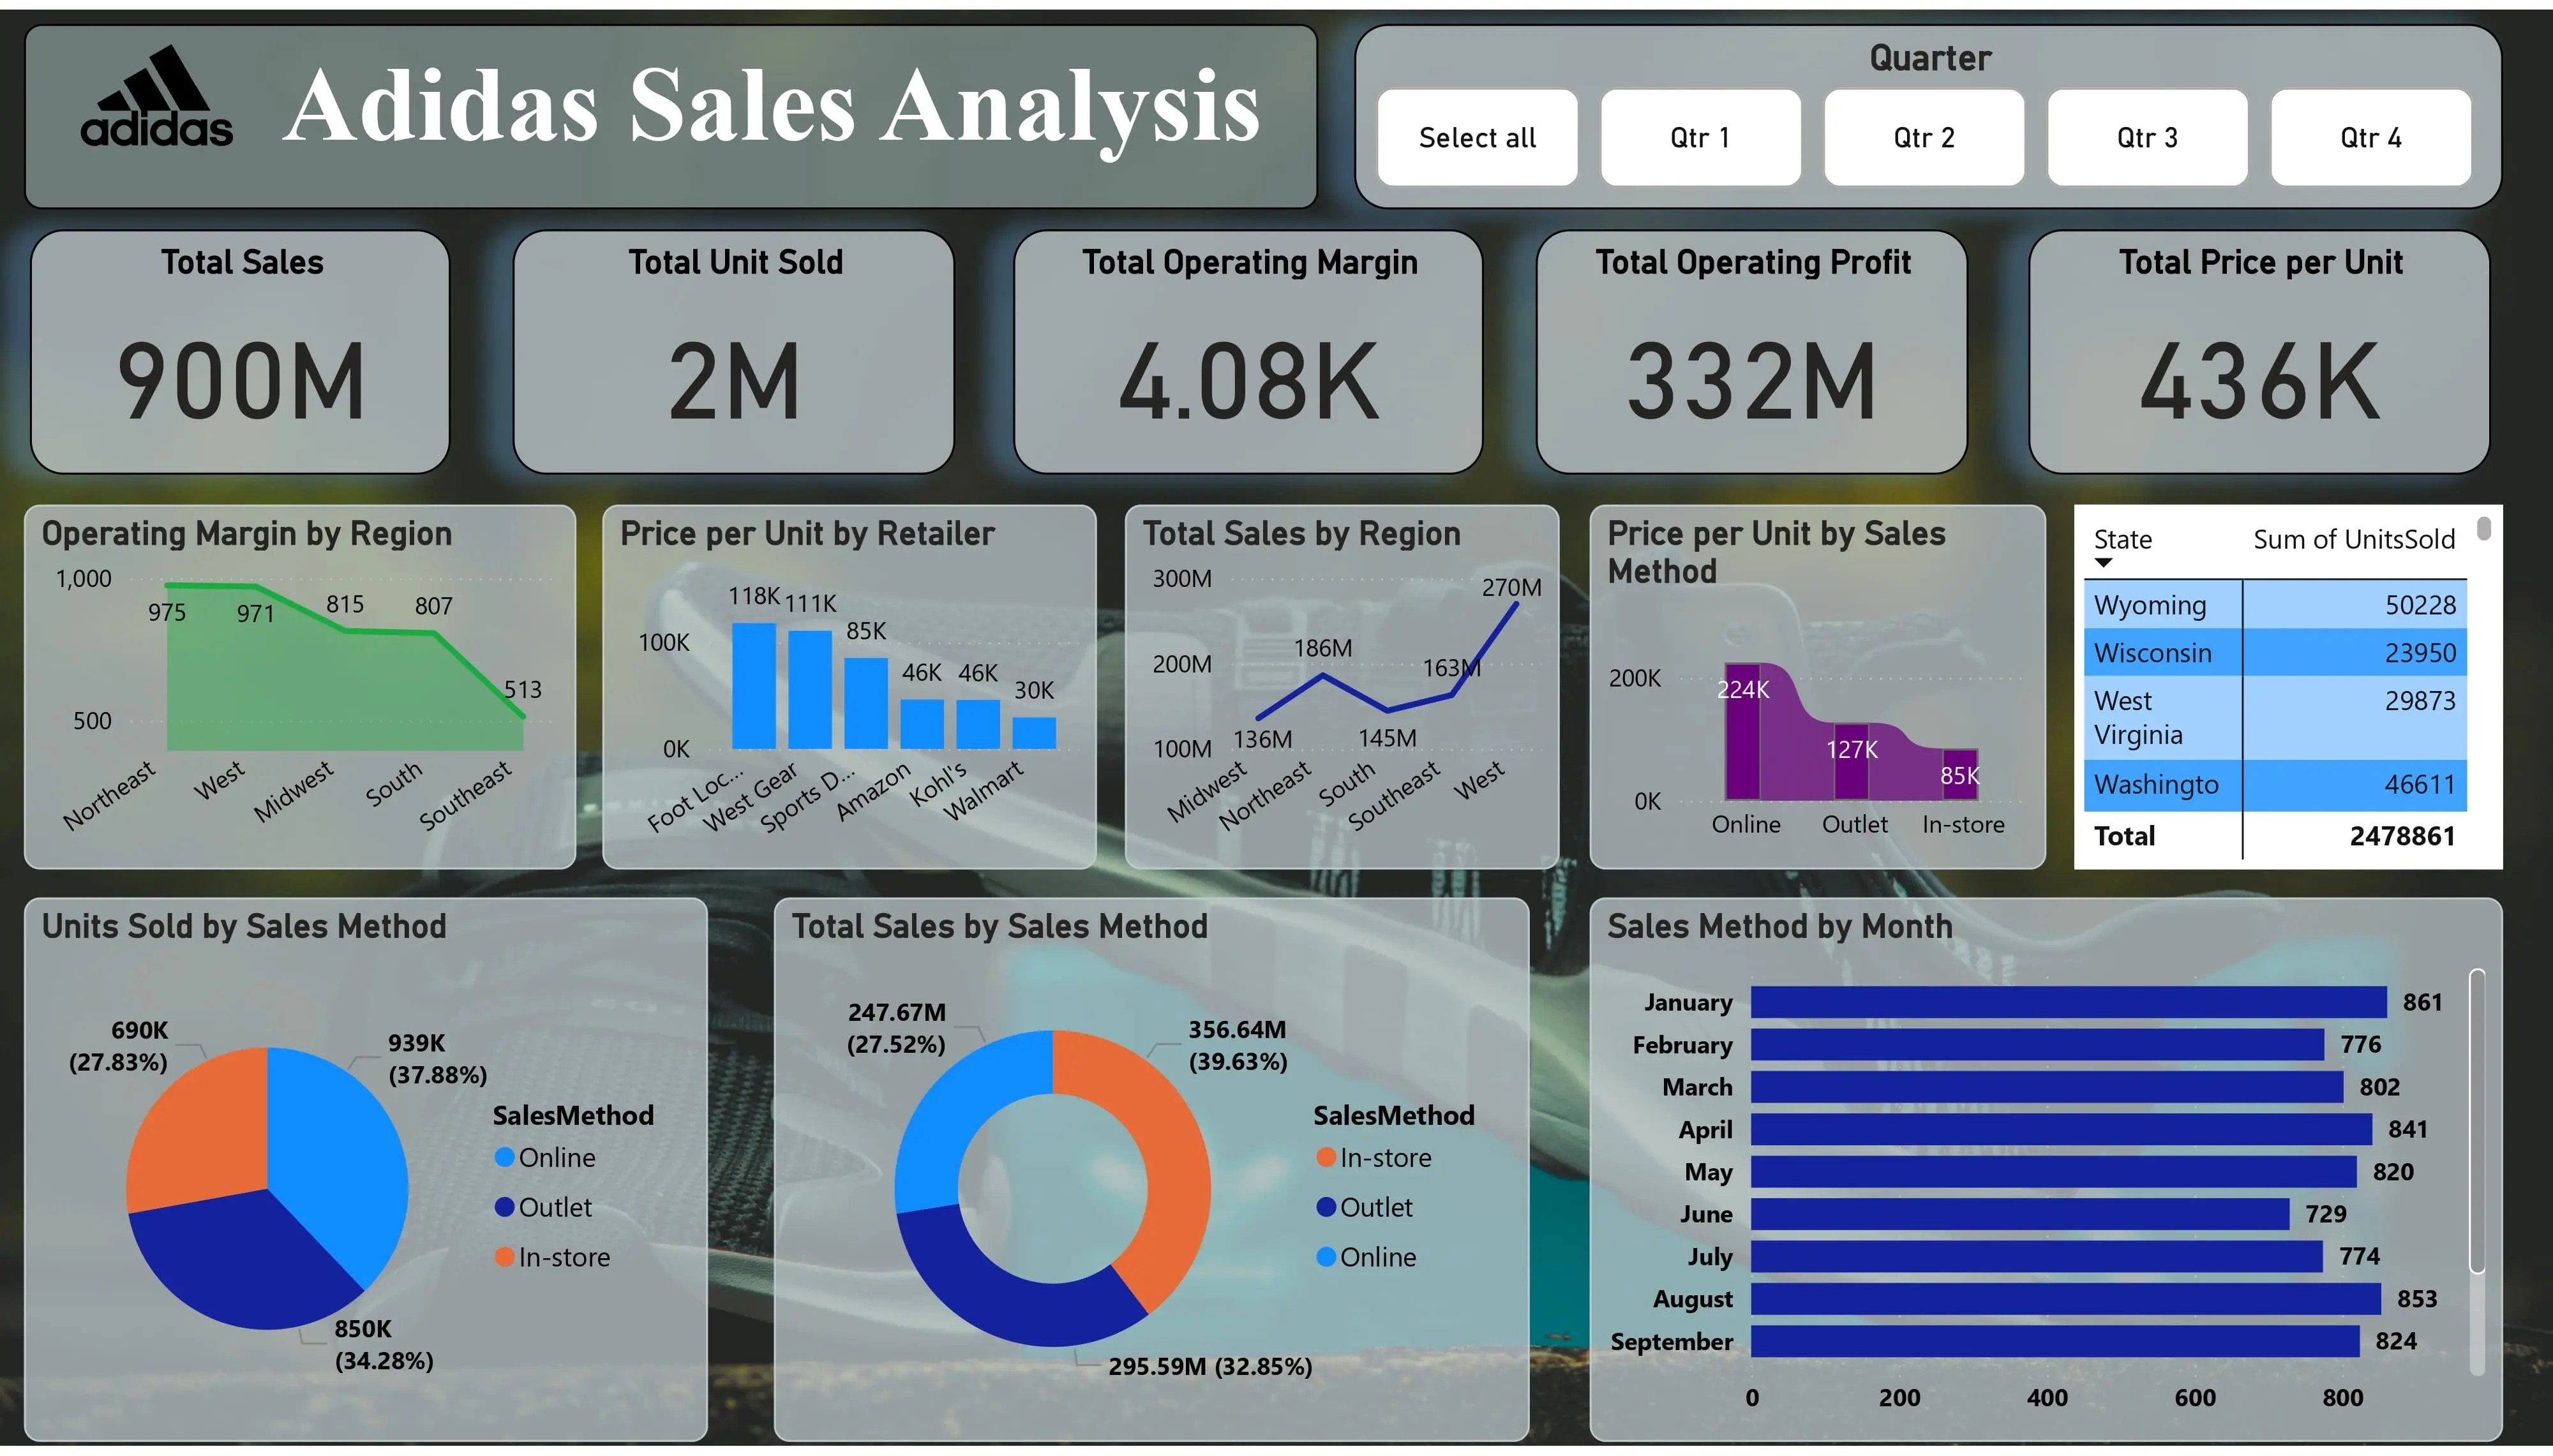
Adidas Sales Analysis with MS PowerBI
Conducted an in-depth data analysis of Adidas' sales performance using MS Power BI, creating interactive dashboards to track key metrics such as UnitSold, product performance, regional sales trends, and customer demographics. Identified actionable insights to enhance decision-making and drive business growth.
Adidas Sales Analysis with MS PowerBI
Business Domain: Retail
This report provides a detailed analysis of Adidas's sales performance using MS Power BI, focusing on key metrics like operating profit, units sold, price per unit, and sales by region and sales method. and identified actionable insights to enhance decision-making and drive business growth.
View Project:  GitHub
 MS PowerBI
 Linkedin
Tools Used:
 MS Excel |
 MS PowerBI
Project Details:
Insights and Key Metrics:-
-
Profitability and Sales Performance: The maximum operating profit of $390,000 and a sum of total sales amounting to $900 Million highlight the company's strong financial performance. The operating margin of 0.80 indicates the efficiency of operations, especially in high-performing regions like the Northeast and West.
-
Regional Performance: The West region generated the highest total sales at $300 Million, reflecting strong market demand. In contrast, the Southeast region reported the lowest total sales at $100 Million, with a lower operating margin of $500, suggesting potential opportunities for growth or market strategy adjustments.
-
Sales by Retailer: Foot Locker achieved the highest price per unit ($125,000), indicating it is a premium retailer for Adidas products. On the other hand, Walmart had the lowest price per unit ($50,000), potentially representing more budget-conscious customers or a higher volume of sales at lower price points.
-
Sales Method Insights: Online sales led in both price per unit ($200,000) and units sold (939,000 units), making up 37.88% of total sales, reflecting a strong trend toward e-commerce. Meanwhile, in-store sales contributed to the highest total sales ($356.64 Million) despite having a lower price per unit ($100,000), emphasizing the continued significance of brick-and-mortar retail.
-
Monthly Trends: Sales activity was highest in August, with the greatest number of sales methods being employed. Conversely, April saw the lowest sales volume, suggesting seasonal fluctuations or potential areas for marketing focus during slower months.
Conclusions:-
The report reveals Adidas's overall positive sales performance, but highlights areas for improvement. By focusing on optimizing sales in the Midwest region, exploring new retail channels, enhancing in-store experiences, and capitalizing on peak months, Adidas can further strengthen its market position.
Recommendations:-
-
Increase Sales in the Midwest Region: Analyze the reasons for the low sales in the Midwest and implement strategies to improve performance in this region.
-
Explore New Retail Channels: To further increase market share, consider expanding into new retail channels like e-commerce platforms and mobile apps.
-
Optimize In-Store Sales: Enhance the in-store shopping experience to increase sales through this channel.
-
Capitalize on Peak Months: Develop marketing campaigns and promotions to maximize sales during peak months like August, September, and January.
Connect & Follow:
If you found my project insightful, I’d love to connect! I’m passionate about creating impactful data-driven solutions like this one to drive success. Follow me for more updates on my projects and insights. Let’s collaborate and grow together!
Data Scientist | Data Analyst | SEO Analyst
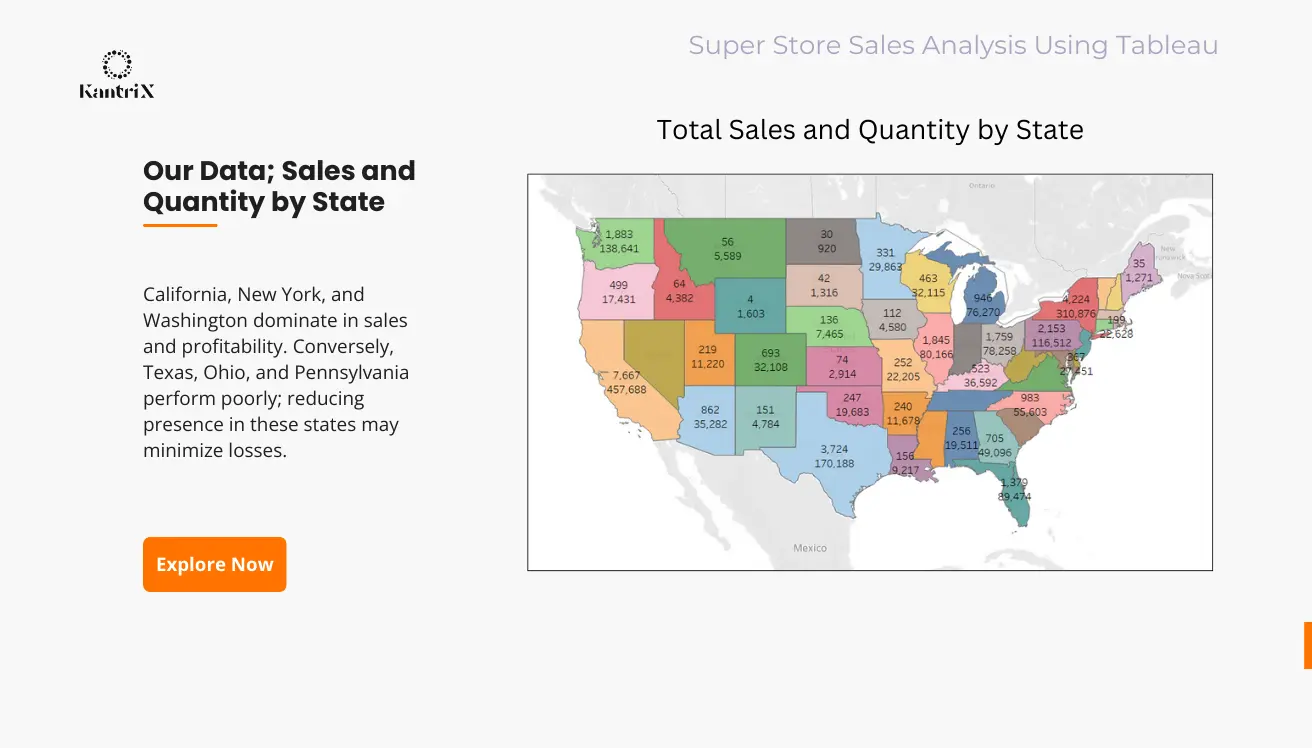
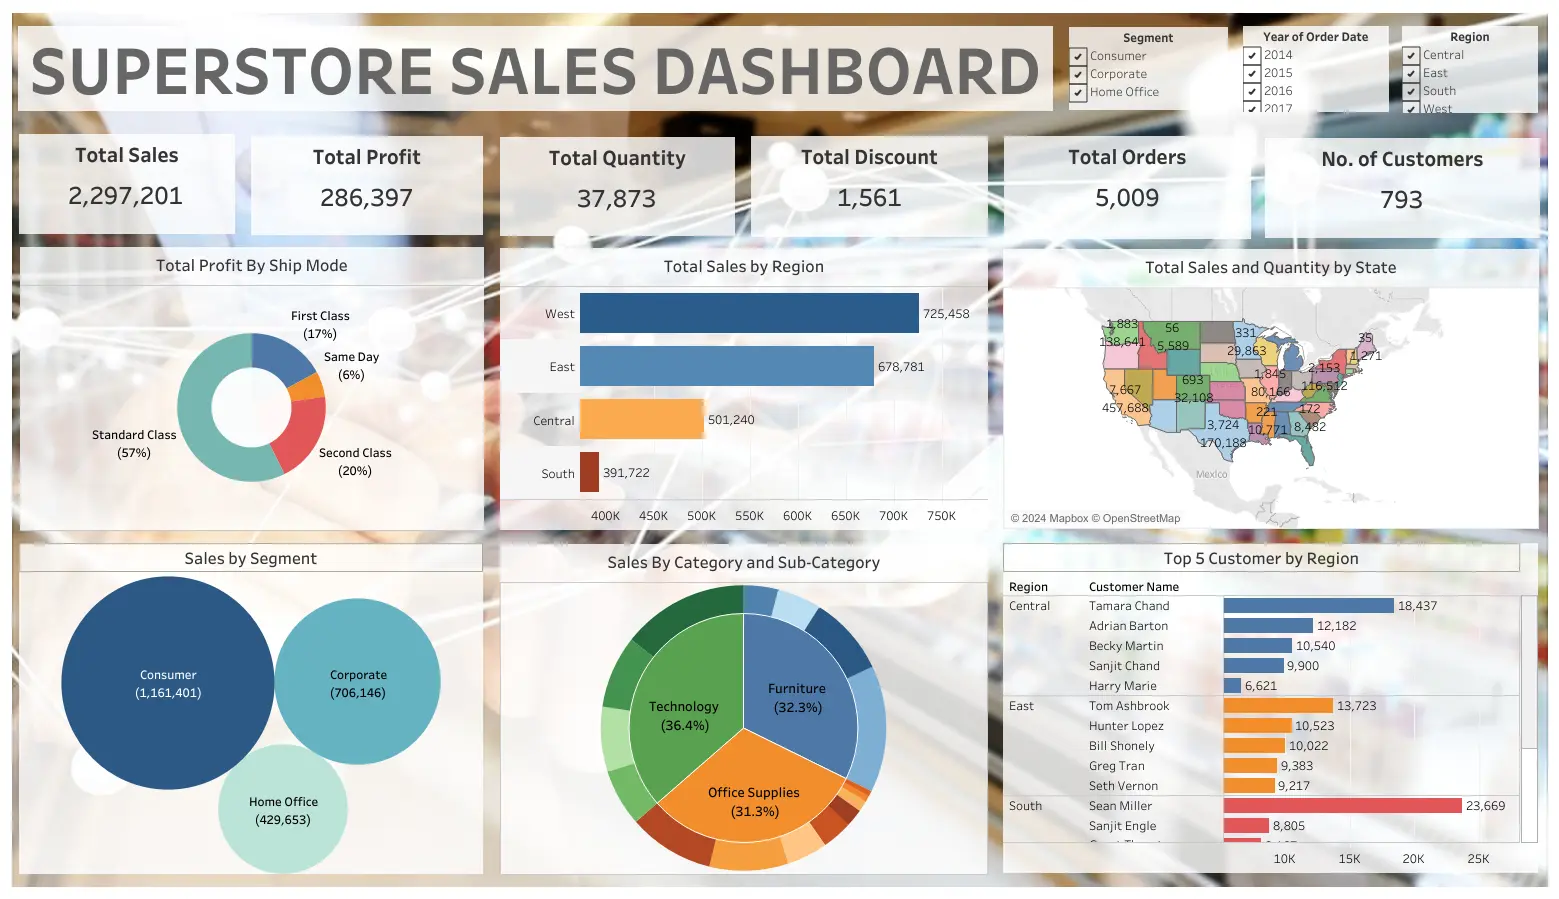
Superstore Sales Analysis with Tableau
Conducted data analysis using MS Excel, MySQL, and Tableau to identify patterns across products, regions, categories, and customer segments. Leveraged insights to optimize efficiency and profitability. MS Excel served as the data repository, MySQL enabled in-depth analysis, and Tableau visualized trends to enhance decision-making.
Superstore Sales Analysis with Tableau
Business Domain: Retail
Identifying patterns in products, regions, categories, and customer segments to enhance efficiency and optimize profits using MySQL. The analysis will be performed using MS Excel for data processing, SQL for querying, and Tableau for visualization.
View Project:  Tableau
 GitHub
 Linkedin
Tools Used:
 MS Excel |
 MySQL |
Project Details:
Insights and Key Metrics:-
-
Overall Performance:
-
Total sales of $2.3M, with a profit margin of $286K, indicate strong revenue performance across 5,009 orders and 793 customers.
-
A total of 37,873 units sold with an average discount of $1,561 shows effective inventory movement with limited reliance on heavy discounting.
-
Sales by Ship Mode:
-
Standard Class contributed the highest profit at 57%, reflecting its popularity as the most cost-effective shipping option.
-
First Class and Same Day collectively account for 23% of total profits, suggesting potential for premium shipping strategies.
-
Sales by Region:
-
The West region leads with $725K in sales, showcasing it as a key driver of overall revenue.
-
The South region underperformed with $391K, highlighting opportunities for targeted marketing and improvement.
-
Sales by Segment:
-
Consumer Segment dominates with $1.16M in sales, indicating a strong focus on retail customers.
-
Home Office contributes the least ($429K), pointing to a need for segment-specific strategies to boost engagement.
-
Sales by Category:
-
Technology leads with 36.4% of sales, followed closely by Furniture (32.3%) and Office Supplies (31.3%), indicating balanced demand across categories.
-
Top Customers by Region:
-
Sean Miller (South) and Tamara Chand (Central) are top-performing customers, collectively contributing over $42K in sales.
-
Leveraging top customers across regions can strengthen loyalty and drive repeat business.
Conclusions:-
-
The West region and Consumer segment are the primary revenue drivers, contributing significantly to total sales and profits.
-
Standard Class shipping is the most profitable shipping mode, while Same Day shipping has lower profit margins despite its premium pricing.
-
The Technology category leads in sales, indicating strong customer demand for tech-related products, followed closely by Furniture and Office Supplies.
-
The South region and Home Office segment underperform compared to other regions and segments, highlighting untapped growth potential.
Recommendations:-
-
Targeted Marketing: Invest in promotional campaigns for the South region and Home Office segment to increase engagement and boost sales.
-
Shipping Strategy Optimization: Promote Standard Class shipping further while exploring cost-reduction strategies for premium shipping modes like Same Day.
-
Product Category Focus: Enhance inventory and marketing efforts in the Technology category, given its strong demand and profitability.
-
Customer Retention: Develop loyalty programs for top customers like Sean Miller and Tamara Chand to ensure repeat business and enhance overall profitability.
Connect & Follow:
If you found my project insightful, I’d love to connect! I’m passionate about creating impactful data-driven solutions like this one to drive success. Follow me for more updates on my projects and insights. Let’s collaborate and grow together!
Data Scientist | Data Analyst | SEO Analyst
Blinkit Sales Analysis with MS PowerBI
Conducted Blinkit sales analysis using MS PowerBI, developing interactive dashboards to track sales trends across product performance, item types, outlet types, fat content, and customer demographics. Insights from the analysis drove data-backed decisions, optimizing business strategies for improved outcomes.
Blinkit Sales Analysis with MS PowerBI
Business Domain: E-commerce
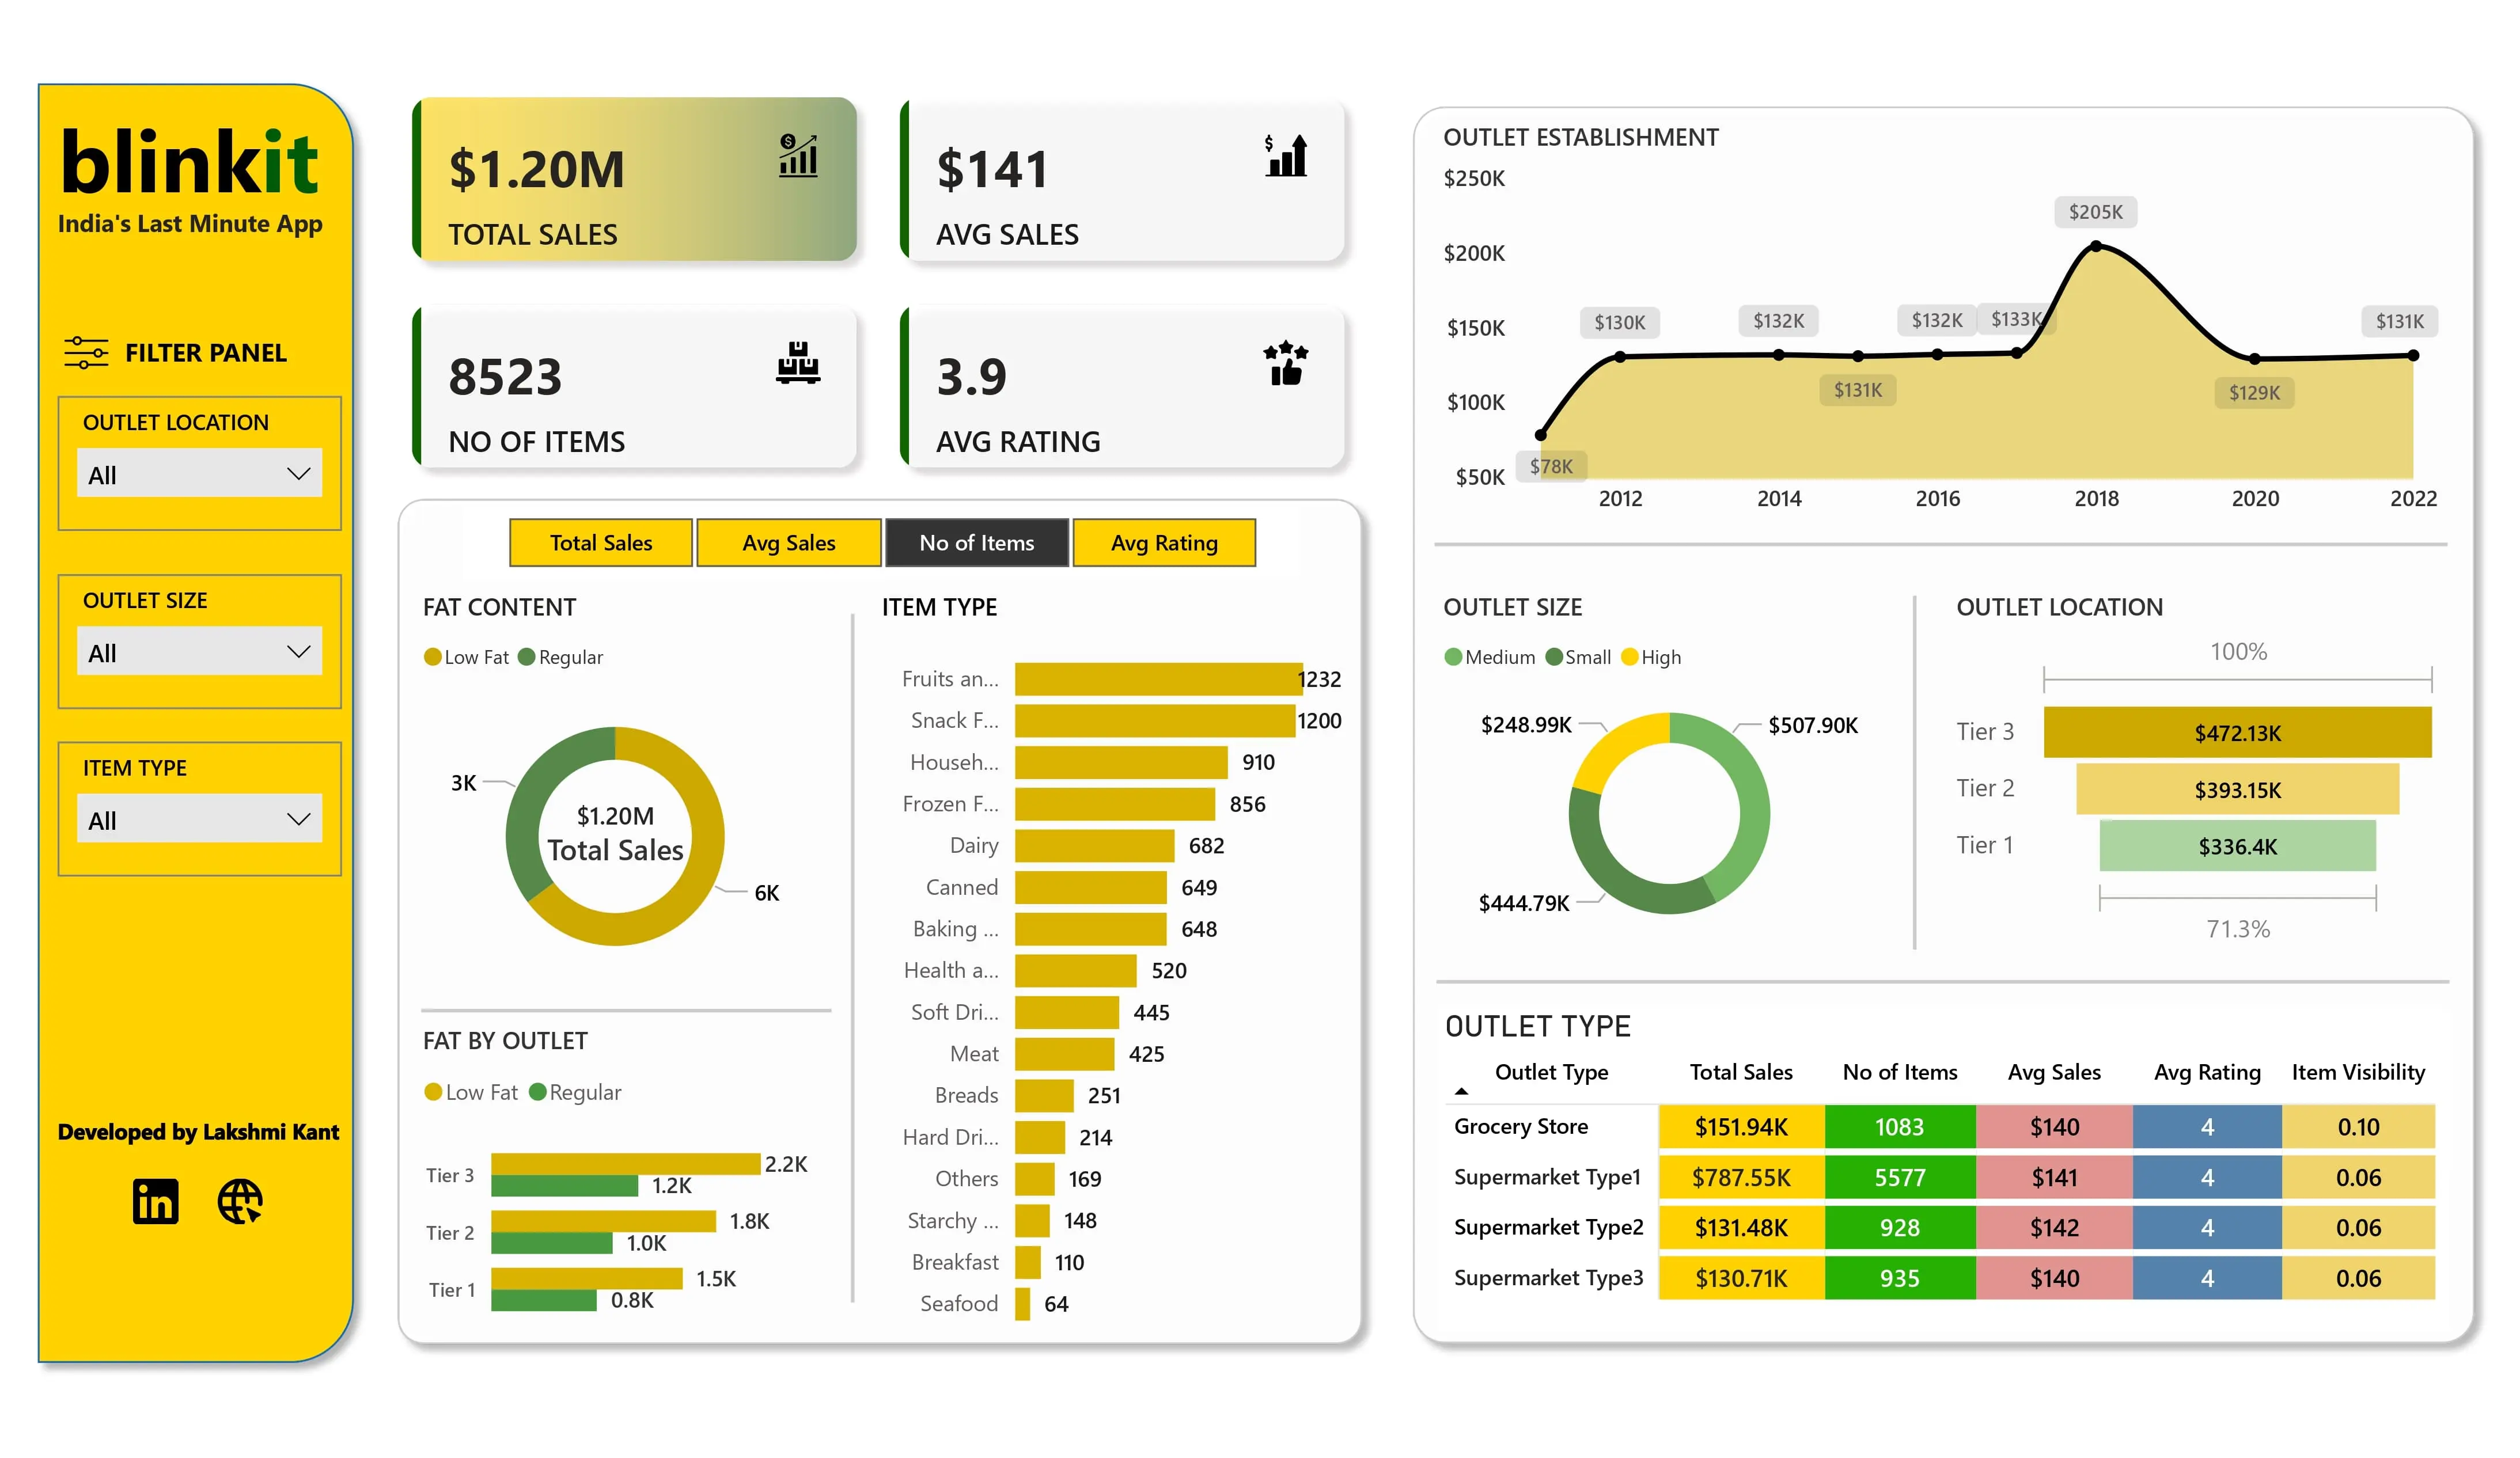
This dashboard provides insights into blinkit's business performance, covering various aspects such as total sales, average sales, number of items, average rating, fat content distribution, item types, outlet size, outlet location, and outlet type.
View Project:  MS PowerBI
 GitHub
 Linkedin
Tools Used:
 MS Excel |
 MS PowerBI
Project Details:
Insights and Key Metrics:-
-
Total Sales Performance: Blinkit's total sales reached $1.20 million, with an average sale of $141 and 8,523 items sold. The overall customer satisfaction is reflected in an average rating of 3.9.
-
Fat Content Distribution: Regular Fat products outperformed Low Fat products in total sales ($776.32K vs. $425.36K). Tier 1 outlets had the highest sales for Regular Fat items, while Tier 3 outlets led in Low Fat sales.
-
Item Type Analysis Fruits and Vegetables and Snacks topped sales with $0.18M each. Seafood, however, had the lowest total sales value at $0.01M.
-
Outlet Size Impact: Medium-sized outlets generated the highest total sales ($444.79K), while High outlets contributed the least ($248.99K), suggesting a preference for medium-sized spaces.
-
Outlet Location and Type Insights: Tier 3 outlets had the highest sales ($472.13K), with Supermarket Type 1 outlets being the most profitable, indicating that larger, well-located outlets drive higher revenue.
Conclusions:-
-
Product Preferences: Regular Fat products dominate sales, suggesting that customers prefer traditional options over healthier, low-fat alternatives. This trend is consistent across outlet tiers, although Tier 3 outlets see a better balance between the two product types.
-
Outlet Size and Performance: Medium-sized outlets contribute the most to total sales, while High outlets perform the least. The analysis suggests that outlet size plays a significant role in profitability, with medium-sized outlets striking a balance between cost and customer footfall.
-
Location Matters: Tier 3 outlets outperform others in terms of total sales, indicating that larger and more strategically placed outlets are more profitable. This reinforces the importance of location and the scale of operations.
-
Item Type Trends: Fruits and Vegetables, along with Snacks, are top-performing categories. On the other hand, Seafood underperforms significantly, indicating either a mismatch with customer preferences or issues in inventory management.
Recommendations:-
-
Focus on Popular Products: Blinkit should consider expanding the range of Regular Fat products, particularly in Tier 3 outlets, where they have a strong customer base. Promoting Low Fat items more effectively could help balance the product mix.
-
Optimize Outlet Strategy: Given that medium-sized outlets are the most profitable, Blinkit should evaluate whether expanding the number of medium-sized outlets in high-performing locations would be more beneficial than increasing the number of High outlets.
-
Revise Seafood Strategy: Given the poor performance of Seafood, Blinkit should consider reducing its inventory, offering discounts, or exploring marketing strategies that can improve its appeal to customers.
-
Leverage Tier 3 Locations: Expand operations in Tier 3 locations, as they show the highest sales, possibly by opening larger outlets or improving the product offering to attract more customers.
-
Enhance Customer Experience: With an average rating of 3.9, there is room for improvement in customer satisfaction. Blinkit could focus on improving product quality, delivery times, or customer support to boost ratings and drive repeat business.
Connect & Follow:
If you found my project insightful, I’d love to connect! I’m passionate about creating impactful data-driven solutions like this one to drive success. Follow me for more updates on my projects and insights. Let’s collaborate and grow together!
Data Scientist | Data Analyst | SEO Analyst

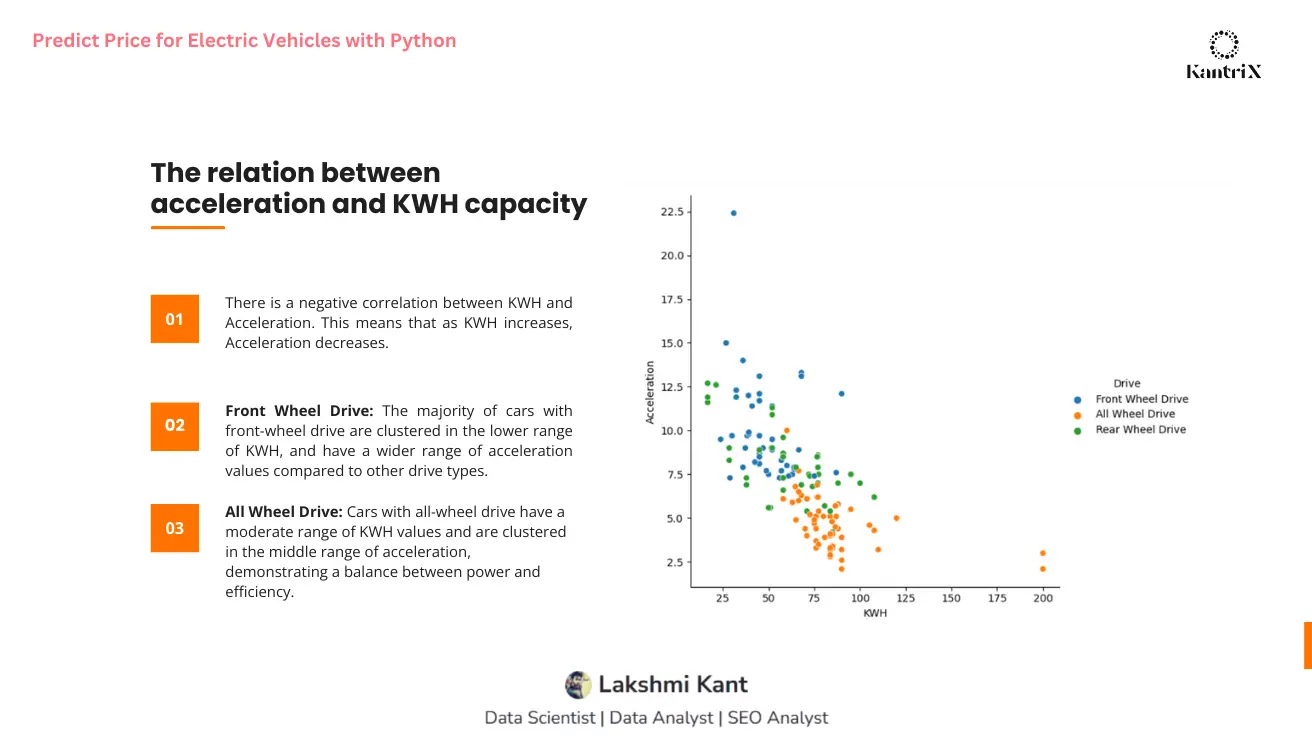
Predict Price for Electric Vehicles with Python
Utilized Python and machine learning to analyze an EV dataset, addressing missing data and standardizing prices to UK Pounds. Conducted EDA and visualizations to identify market trends and data distribution. Developed a predictive model to estimate vehicle prices, supporting investment decisions and fostering innovation in the EV market.
Predict Price for Electric Vehicles with Python
Business Domain: Automotive
This project involves analyzing a dataset of electric vehicles through exploratory data analysis (EDA) and visualizations. Key insights into market trends and data distribution are uncovered, aiding market research. The analysis identifies growth opportunities and areas for innovation in the expanding EV market. Additionally, the project predicts vehicle prices based on available parameters, focusing on prices in UK Pounds for consistency, despite some vehicles listing prices in euros.
View Project:  GitHub
 Linkedin
 Kaggle
Tools Used:
 Python |
 Pandas |
 NumPy |
 Matplotlib |
 Scikit-learn
Project Details:
Insights and Key Metrics:-
-
Data Correlation and Relationships:
-
The correlation heatmap revealed strong relationships, such as a 0.89 correlation between vehicle range and battery capacity (KWH), confirming that higher battery capacity results in greater range.
-
Pricing in Germany and the UK showed a correlation of 0.7, highlighting consistency in market pricing trends.
-
Brand Dominance:
-
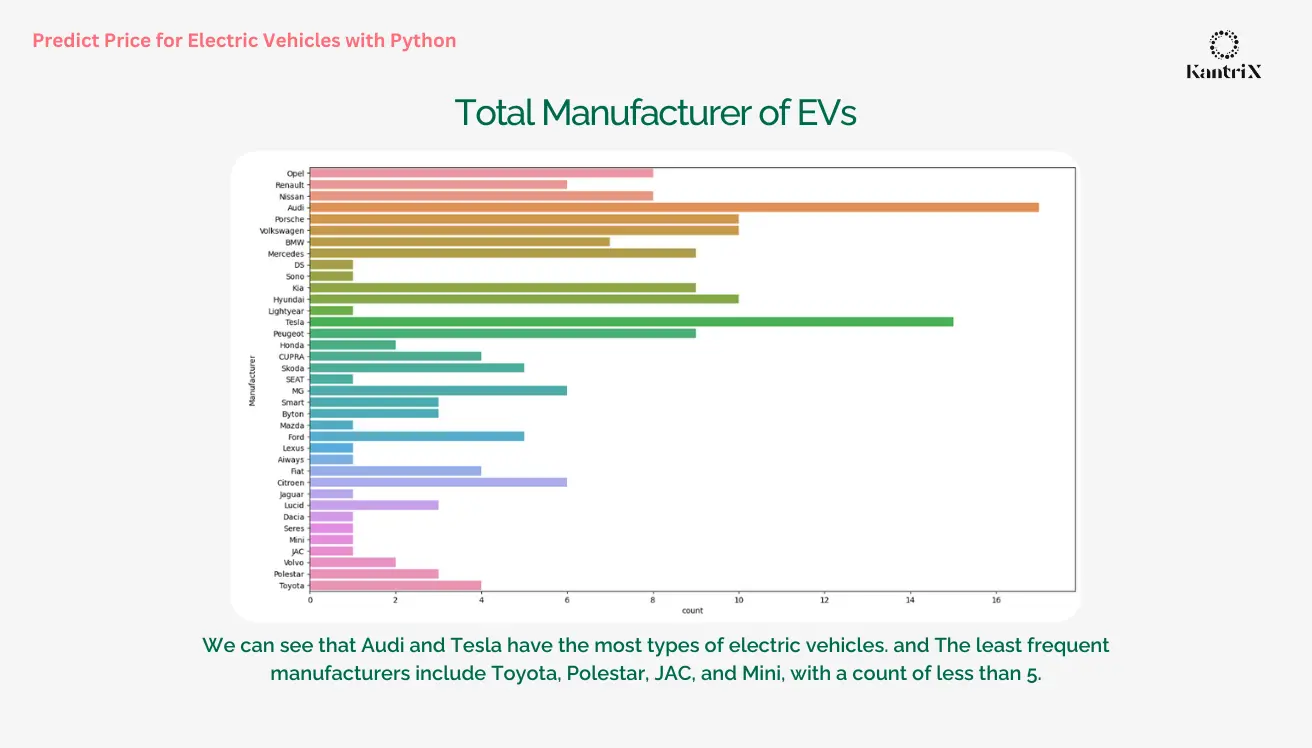
Audi and Tesla lead in electric vehicle (EV) diversity, showcasing their dominance and innovation in the EV market.
-
Data Exploration and Trends:
-
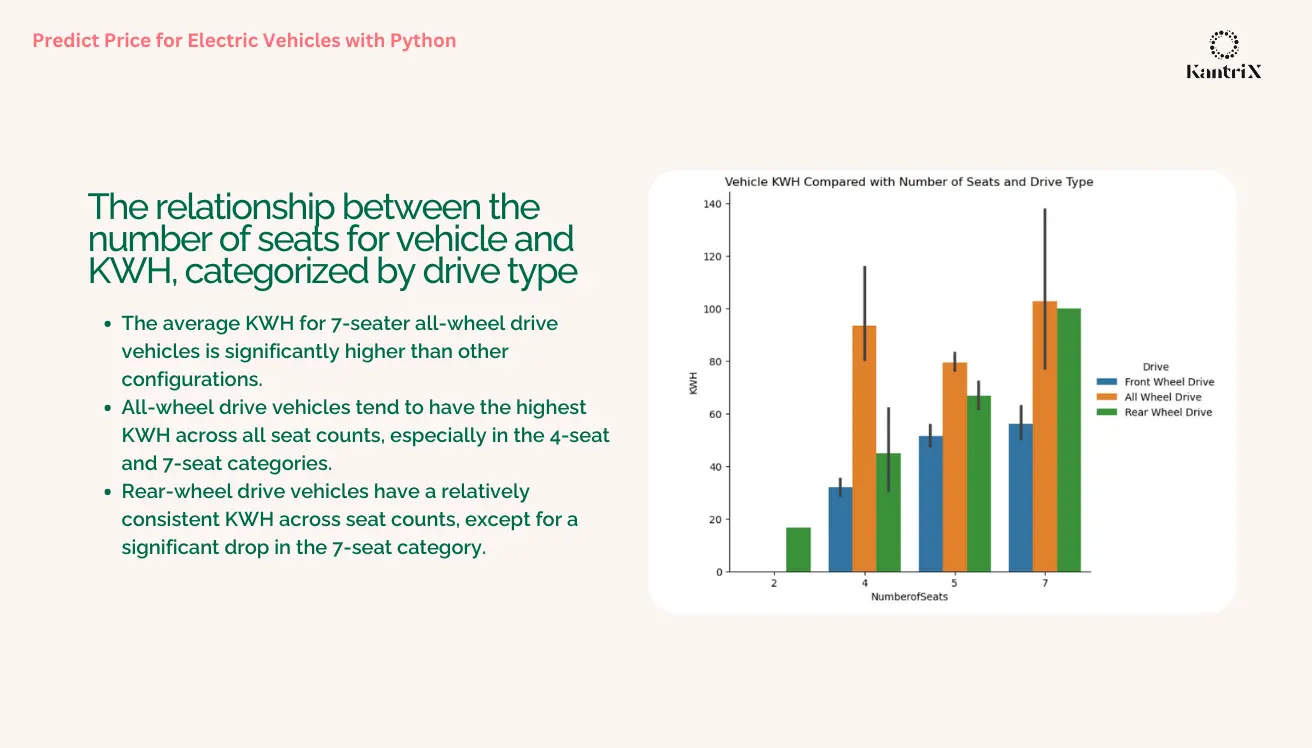
Plots and visualizations enhanced understanding of data distribution and relationships, identifying factors like top speed and battery capacity as key drivers of price variation.
-
Price Standardization:
-
Prices were standardized to UK Pounds (GBP) from multiple currencies, with an exchange rate of 1 Euro = 0.85 GBP, ensuring consistency across data points for reliable analysis and predictions.
-
Machine Learning Predictive Model:
-
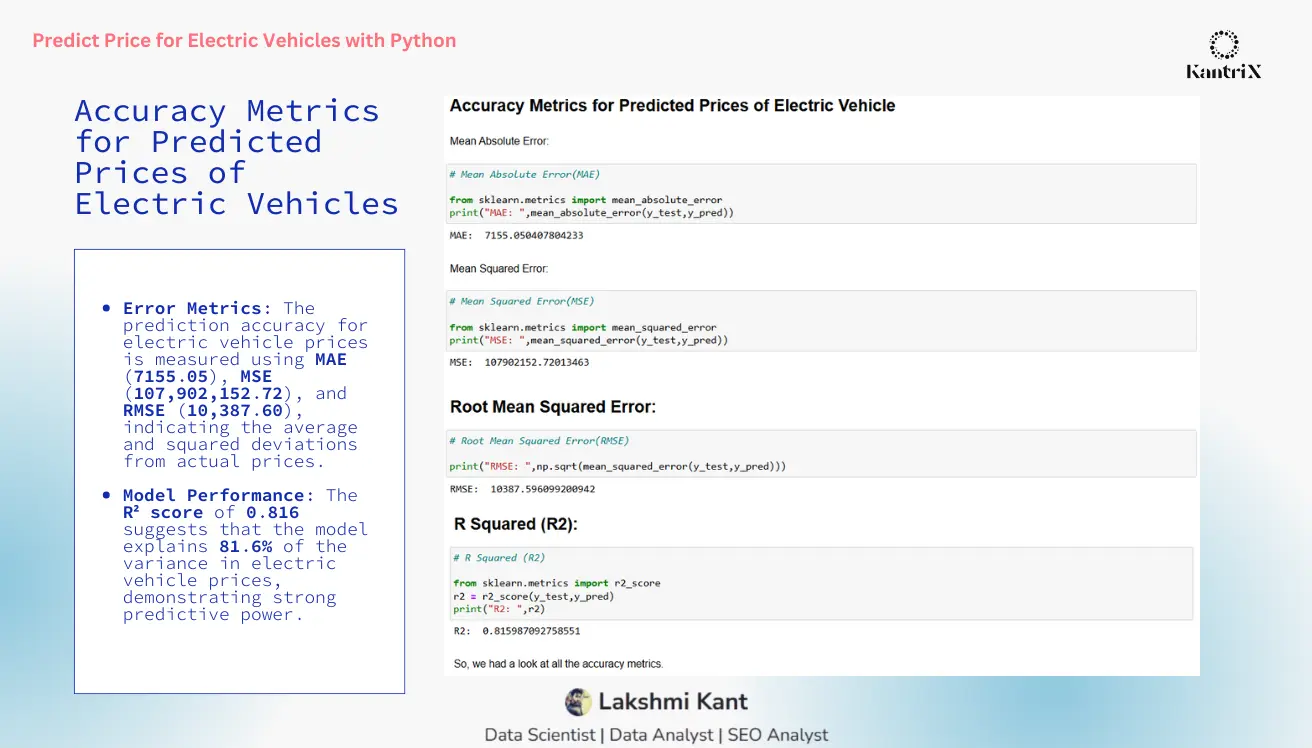
A RandomForestRegressor was employed to predict EV prices based on features such as top speed, range, and battery capacity. The model achieved solid performance metrics:
-
Mean Absolute Error (MAE): 7,155.05
-
Mean Squared Error (MSE): 107,902,152.72
-
Root Mean Squared Error (RMSE): 10,387.60
-
R Squared (R2): 0.82, indicating strong model accuracy for price predictions.
-
This model supports investment decisions and innovation by accurately estimating EV prices based on key parameters.
Conclusions:-
-
Strong Correlations Identified: The analysis revealed significant relationships between key vehicle attributes, such as battery capacity and range (0.89 correlation), and top speed with price, which align with real-world expectations. This reinforces the importance of these features in determining EV pricing.
-
Market Insights on Pricing: The correlation between prices in Germany and the UK (0.7) indicates similar market dynamics across these regions. It suggests that factors influencing pricing, such as vehicle specifications and brand reputation, remain consistent in both countries.
-
Dominance of Key Brands: Audi and Tesla have the largest variety of EVs, highlighting their established position and influence in the electric vehicle market. This could be a significant consideration for manufacturers and investors.
-
Successful Price Prediction Model: The developed Random Forest Regressor model demonstrates strong performance (R² = 0.816), which provides reliable predictions for EV prices. This can help stakeholders make informed investment decisions.
Recommendations:-
-
Focus on High-Correlation Features: Manufacturers and investors should focus on enhancing key vehicle attributes like top speed, battery capacity, and range, as they strongly influence the price. Improving these aspects may lead to better market positioning.
-
Regional Market Analysis: Given the pricing similarities between Germany and the UK, regional market strategies should consider these correlations to optimize pricing and market entry strategies in both countries.
-
Data Enrichment: Further refinement of the model could be achieved by enriching the dataset, especially addressing missing data points, and including additional features such as vehicle age, brand reputation, and market trends.
-
Model Optimization for Broader Application: While the current model is effective for UK-based price predictions, expanding it to include other regions and refining it with more diverse datasets could improve its accuracy and applicability to global markets.
Connect & Follow:
If you found my project insightful, I’d love to connect! I’m passionate about creating impactful data-driven solutions like this one to drive success. Follow me for more updates on my projects and insights. Let’s collaborate and grow together!
Data Scientist | Data Analyst | SEO Analyst

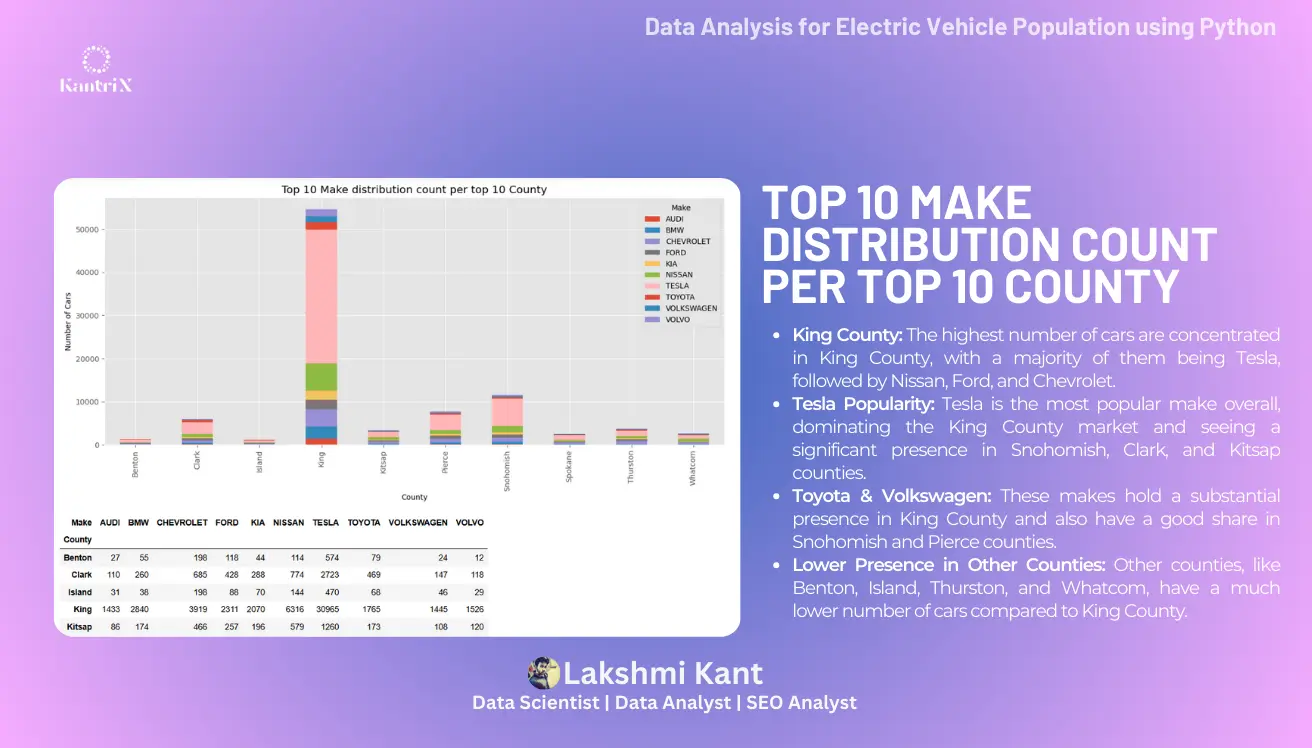
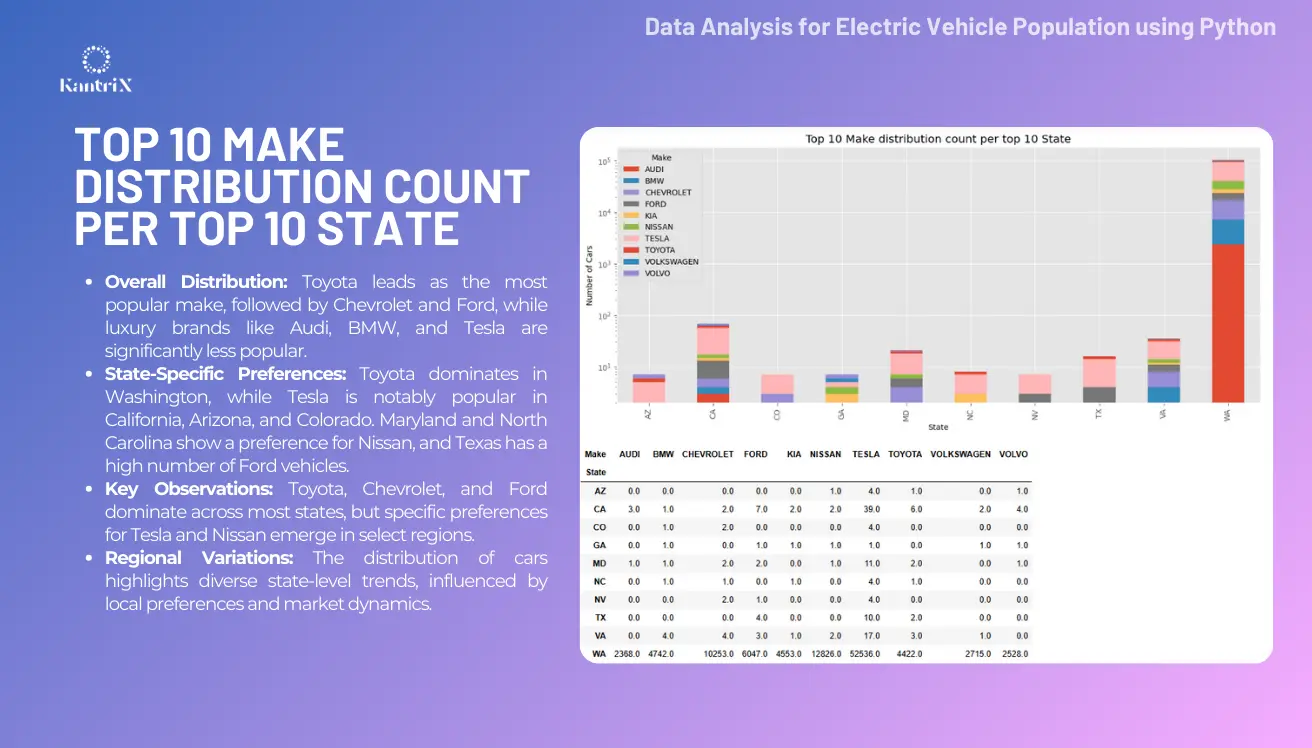
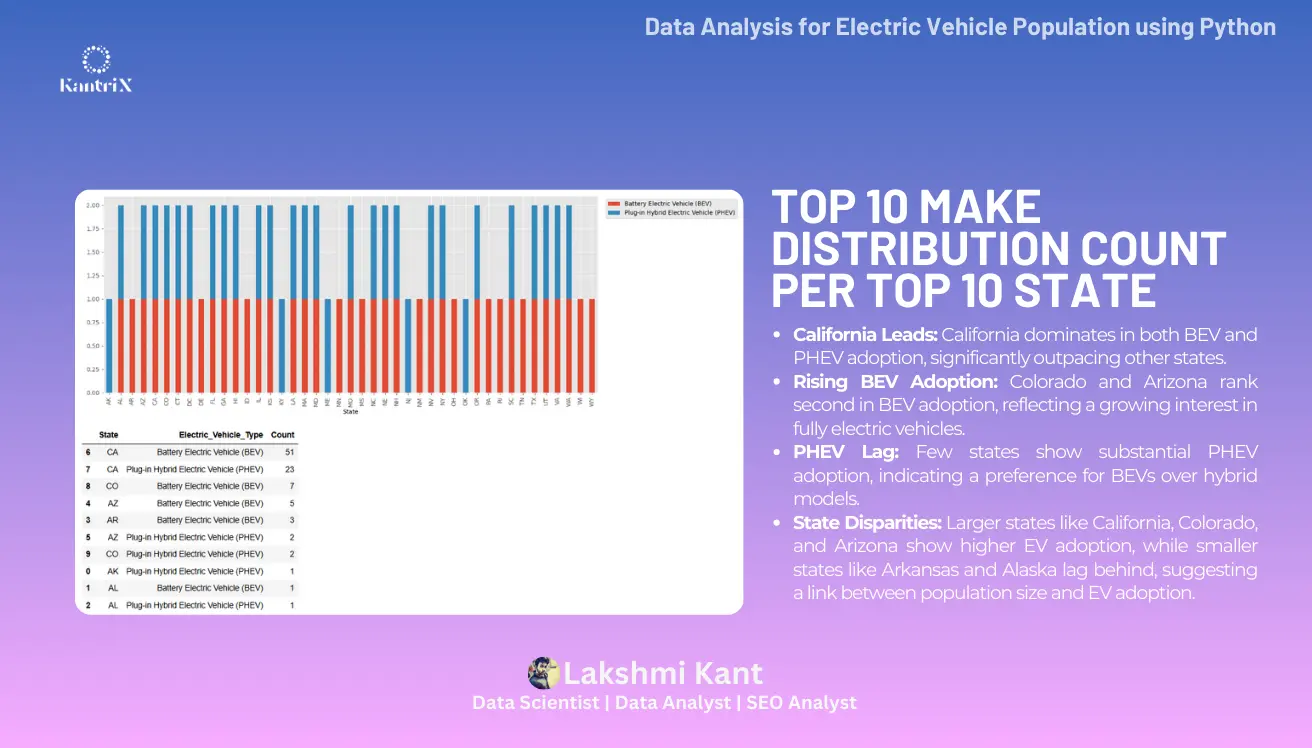
Data Analysis for Electric Vehicle Population with python
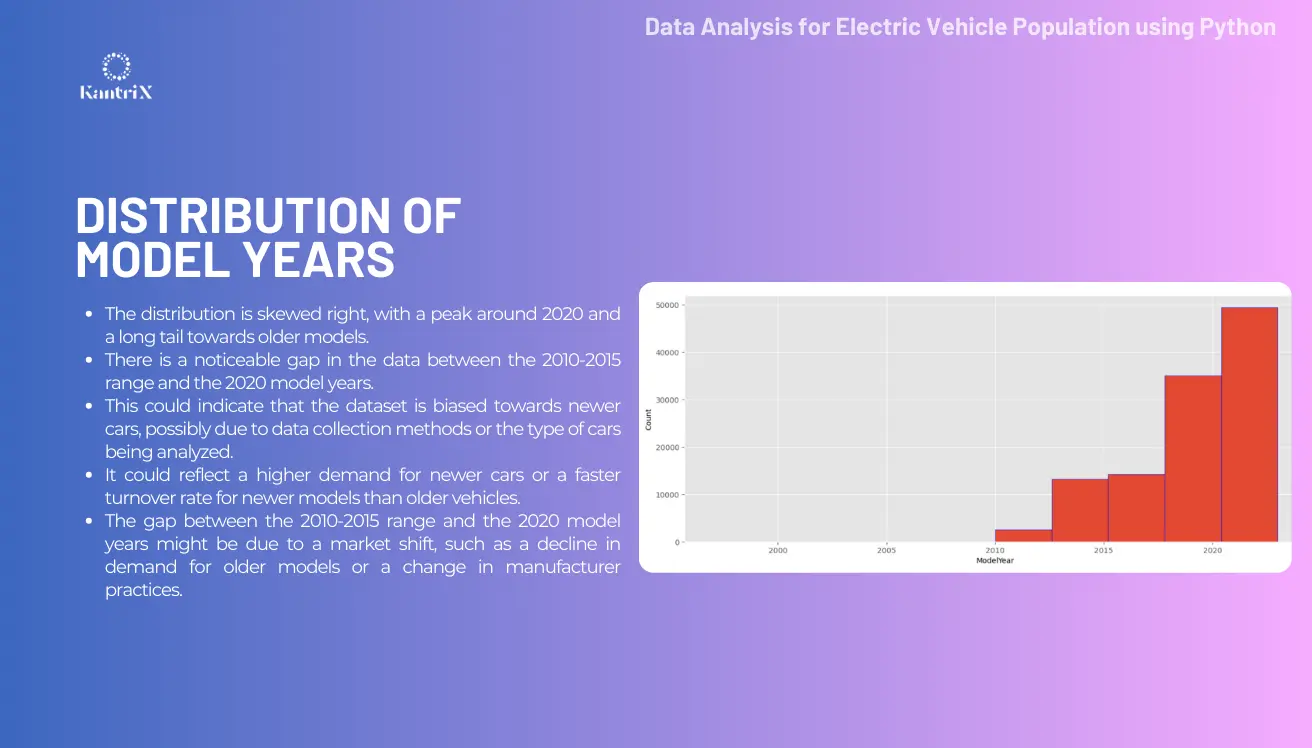
Examined the Electric Vehicle Population dataset featuring BEVs and PHEVs registered with the Washington State DOL. Using Python libraries, performed EDA to uncover top 10 vehicle counts by county, city, state, and postal code, revealing trends like King County and Seattle leading registrations, with Tesla as the dominant brand.
Data Analysis for Electric Vehicle Population
Business Domain: Automotive
This analysis of electric vehicle (EV) registrations in Washington State, based on data from the Department of Licensing (DOL), reveals critical trends, top-performing regions, and opportunities for market expansion. The dataset focuses on Battery Electric Vehicles (BEVs) and Plug-in Hybrid Electric Vehicles (PHEVs), enabling us to uncover detailed insights about EV adoption patterns.
View Project:  GitHub
 Linkedin
 Kaggle
Tools Used:
 Python |
 Pandas |
 NumPy |
 Matplotlib |
 GeoPandas
Project Details:
Insights and Key Metrics:-
-
County-Level Analysis:
-
King County leads with 65,268 electric vehicles registered, followed by Snohomish and Pierce Counties.
-
Marketing efforts in these areas could focus on maintaining and upselling existing customer bases.
-
City-Level Analysis:
-
Seattle tops with 22,009 electric vehicle registrations, followed by Bellevue and Redmond.
-
These cities offer robust opportunities for expanding EV infrastructure and promoting new models.
-
State-Level Trends:
-
Washington State holds the highest EV registrations (124,419 vehicles), followed by California, Virginia, and Maryland.
-
Emerging markets such as Arizona, Florida, and Colorado present untapped opportunities for EV growth.
-
Postal Code Insights:
-
Top postal codes (e.g., 98052) in the Seattle metro area collectively house the highest number of electric vehicles, emphasizing the region's EV adoption strength.
-
Vehicle Make Popularity:
-
Tesla dominates as the most registered EV make in Washington State, followed by Nissan, Chevrolet, and Toyota.
-
Tesla also leads in Seattle, with notable presence from BMW, Nissan, and Chevrolet.
-
Audi and BMW show high adoption rates in Washington but underperform in other states, presenting a key marketing opportunity.
-
Market Opportunities:
-
Non-leading manufacturers like Audi, BMW, and Chevrolet could target growing EV markets in states such as Florida, Arizona, and Colorado to expand their presence.
Conclusions:-
This analysis highlights King County, Seattle, and Washington State as critical hubs for EV adoption. With Tesla's dominance, other manufacturers can target specific regions to grow their market share. These insights provide actionable data for marketing strategies, infrastructure planning, and industry growth opportunities.
Recommendations:-
-
Expand Charging Infrastructure: Prioritize increasing EV charging stations in high-density regions like King County and Seattle to support the growing number of EV users and encourage further adoption.
-
Targeted Marketing Campaigns: Focus on promoting Audi, BMW, and Chevrolet electric models in emerging markets such as Arizona, Florida, and Colorado to capture untapped potential.
-
Localized Incentives: Collaborate with local governments to provide incentives, such as tax credits or rebates, in regions with lower EV adoption rates to boost demand.
-
Enhance Postal Code-Based Strategies: Develop tailored marketing and service strategies in the top 10 postal codes with high EV ownership, emphasizing customer loyalty and upselling opportunities.
-
Support Sustainable Fleet Transition: Work with businesses and municipalities to transition their vehicle fleets to BEVs and PHEVs, leveraging insights from the dataset to highlight cost and environmental benefits.
Connect & Follow:
If you found my project insightful, I’d love to connect! I’m passionate about creating impactful data-driven solutions like this one to drive success. Follow me for more updates on my projects and insights. Let’s collaborate and grow together!
Data Scientist | Data Analyst | SEO Analyst

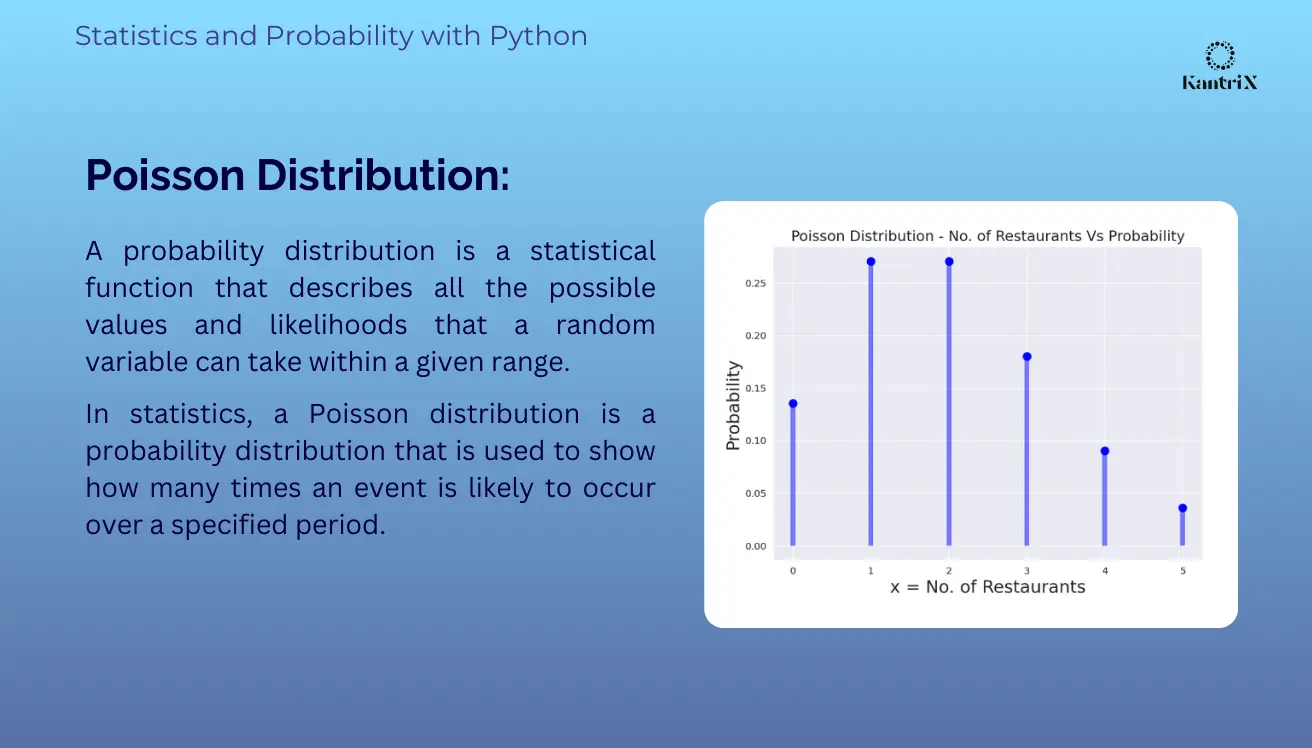
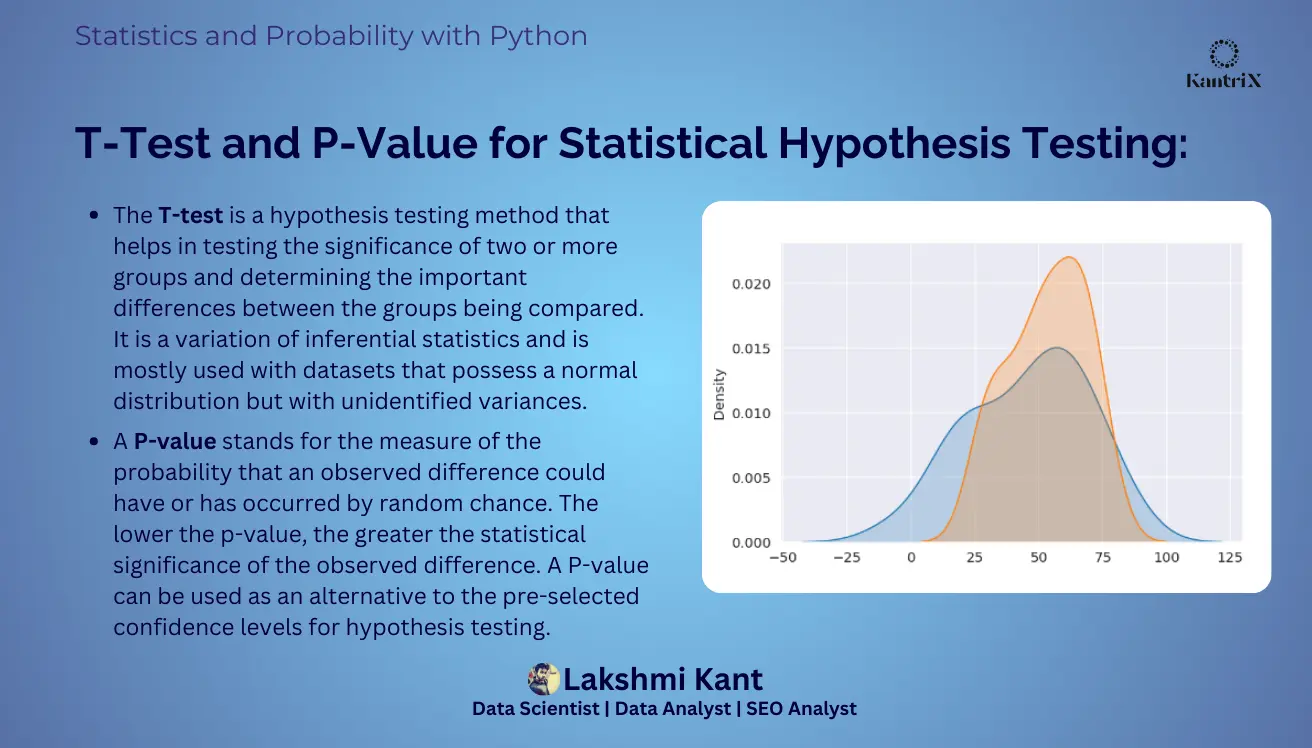
Statistics and Probability with Python
This project focuses on Statistics and Probability with Python for Data Science and Machine Learning. It covers key methods such as calculating mean, standard deviation, skewness, and kurtosis. The project also explores probability distributions, hypothesis testing, and descriptive statistics to enhance data analysis skills.
Statistics and Probability with Python
Business Domain: Research Services
This project was part of my Data Science certification course, where I applied Statistics and Probability using Python for data analysis. Key techniques included calculating mean, standard deviation, skewness, and kurtosis to understand data distributions. I also explored hypothesis testing, probability distributions, and machine learning to uncover insights and improve decision-making through predictive modeling and statistical analysis.
View Project:  Kaggle
 Linkedin
 GitHub
Tools Used:
 Python |
 Pandas |
 NumPy |
 Matplotlib |
Project Details:
Insights and Key Metrics:-
-
Mean & Standard Deviation: Calculated the central tendency (mean) and variability (standard deviation) of key datasets to understand general trends and consistency in data, such as customer behavior or sales performance.
-
Skewness & Kurtosis: Analyzed the skewness and kurtosis of distributions to determine the symmetry and peak of data distributions, identifying outliers or unusual trends that may require further investigation.
-
Probability Distributions: Explored various probability distributions (e.g., normal, binomial, Poisson) to model real-world phenomena and assess the likelihood of different outcomes, guiding decision-making for forecasting and risk management.
-
Hypothesis Testing: Conducted hypothesis testing (e.g., t-tests, chi-square) to validate assumptions or compare groups within the dataset, ensuring robust conclusions about relationships or differences between variables.
-
Descriptive Statistics: Summarized key characteristics of the data using measures like median, mode, range, and percentiles, providing a clear snapshot of the dataset's overall structure and significant features.
-
Machine Learning: Applied machine learning techniques, such as classification or regression models, to identify patterns and predict future outcomes based on historical data, improving predictive accuracy for business strategies.
Impact of the Project:-
-
The projects enhanced my ability to apply advanced statistical methods and machine learning techniques in Python to real-world data. I gained expertise in data analysis, hypothesis testing, and probability distributions, along with hands-on experience in building predictive models, ultimately improving my ability to make data-driven decisions.
Connect & Follow:
If you found my project insightful, I’d love to connect! I’m passionate about creating impactful data-driven solutions like this one to drive success. Follow me for more updates on my projects and insights. Let’s collaborate and grow together!
Data Scientist | Data Analyst | SEO Analyst

Yahoo Finance Analysis with Python
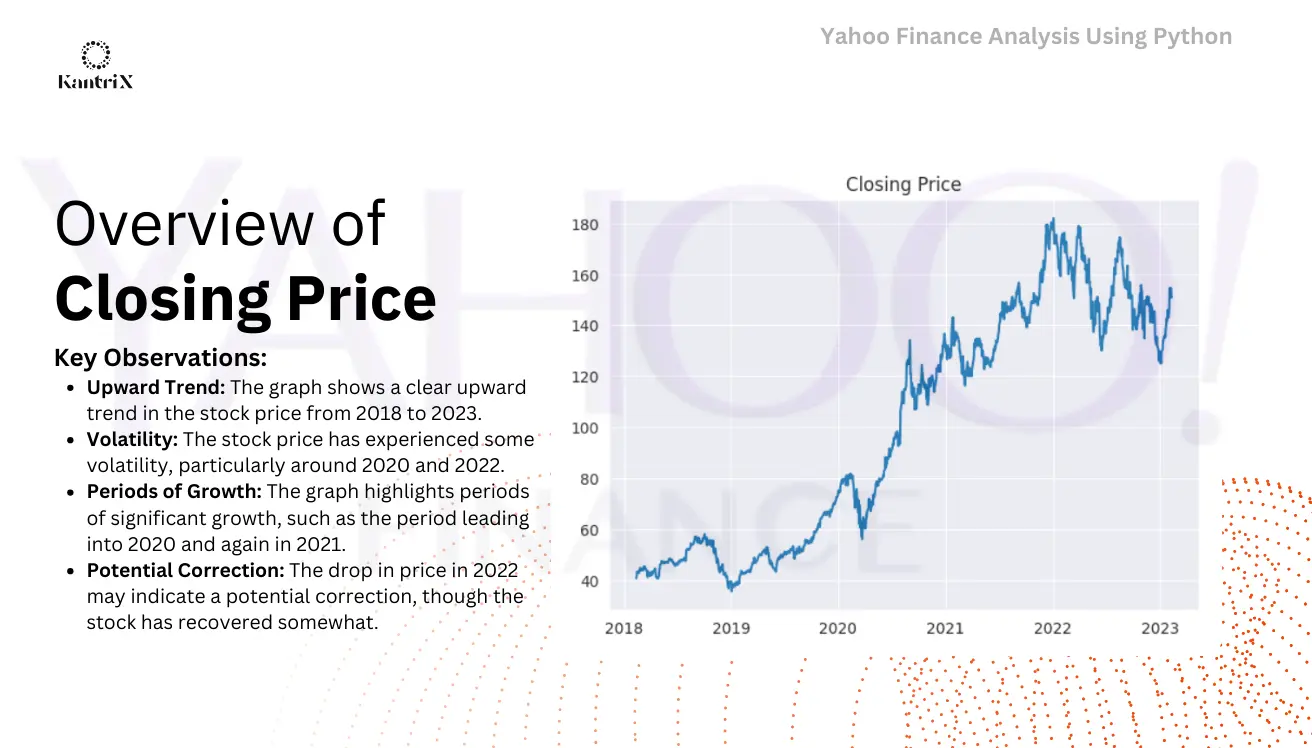
Analyzed stock data from Yahoo Finance using Python libraries like pandas, seaborn, statsmodels (OLS Regression), and matplotlib. The project imports and examines 5 years of stock data, applying advanced data visualization and statistical techniques to identify trends and make predictive analytics for investment strategies.
Yahoo Finance Analysis with Python
Business Domain: BFSI
This project involves analyzing stock data from Yahoo Finance over the last 5 years using Python. The analysis includes data mining, cleaning, manipulation, visualization, EDA, and statistical modeling, including OLS regression for predicting stock price trends. The project leverages powerful data analysis and visualization techniques to uncover insights and forecast future stock performance.
View Project:  GitHub
 Linkedin
Tools Used:
 Python |
 Pandas |
 Matplotlib |
Project Details:
Insights and Key Metrics:-
-
Data Overview:
-
Analyzed 5 years of historical stock data (Jan 2018-May 2023) from Yahoo Finance.
-
Covered multiple metrics, including opening and closing prices, volume, and daily price changes.
-
Trend Analysis:
-
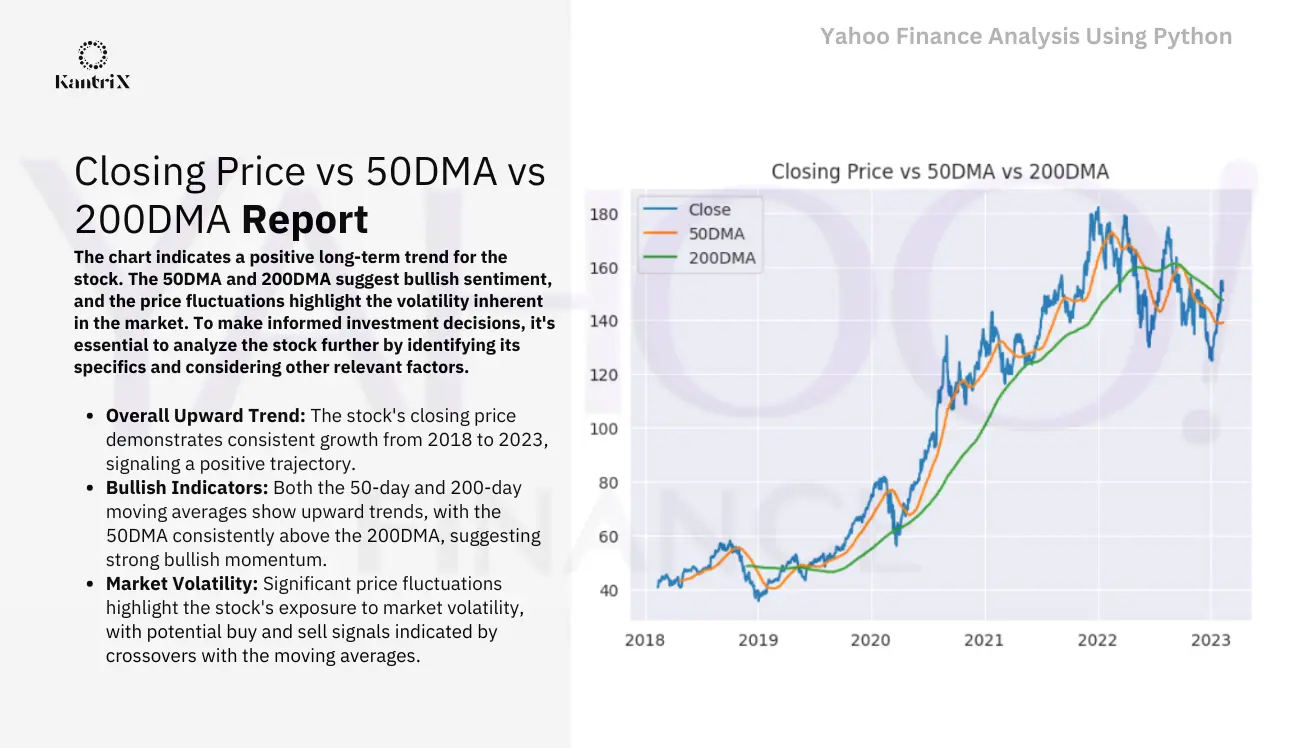
Identified stock price trends using 50-Day Moving Average (50DMA) and 200-Day Moving Average (200DMA) relative to the closing price.
-
Covered multiple metrics, including opening and closing prices, volume, and daily price changes.
-
Performance Metrics:
-
Calculated average daily returns and cumulative returns to evaluate stock performance.
-
Analyzed volatility using standard deviation of returns over the dataset period.
-
Statistical Modeling:
-
Implemented OLS regression to predict closing price trends based on historical data and key metrics like volume, moving averages, and previous price behavior.
-
Visual Insights:
-
Developed time-series tplots of stock prices, 50DMA, and 200DMA to visualize trends and key crossover points.
-
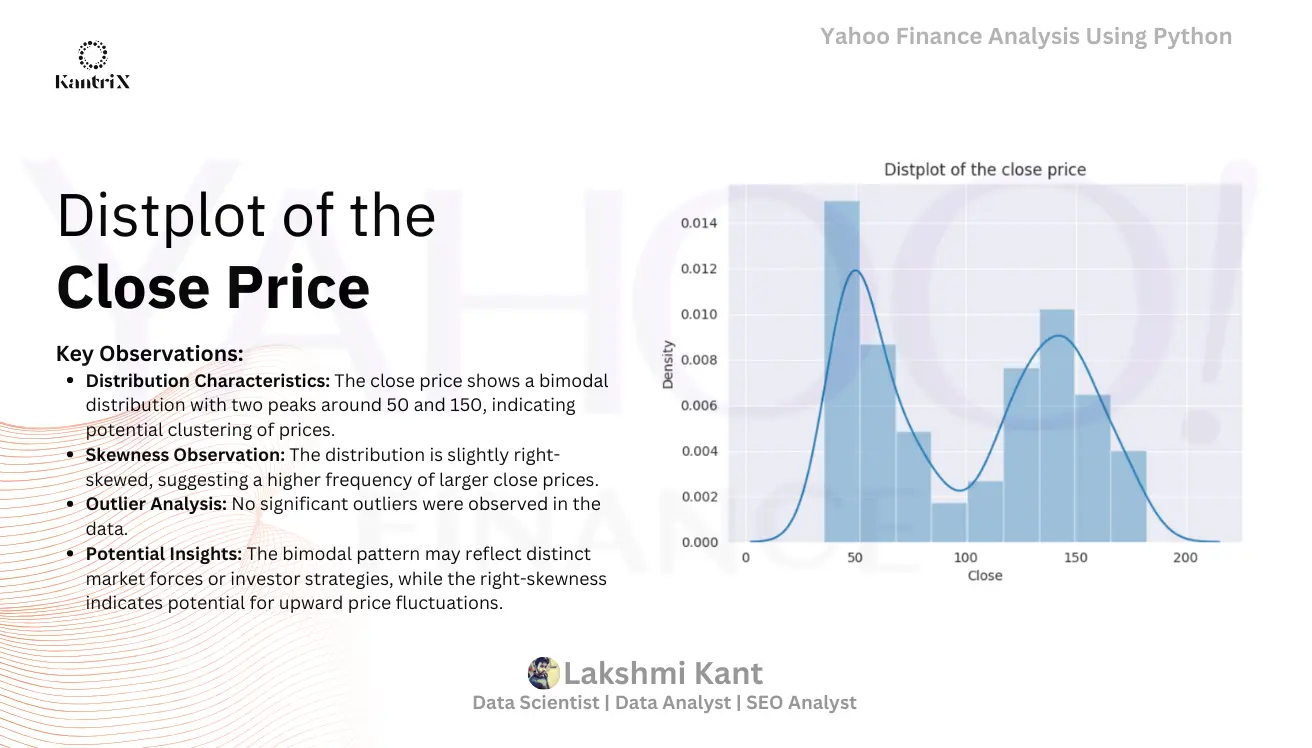
Created histograms and distplots of returns to identify skewness and potential outliers.
-
Data-Driven Forecasting:
-
Leveraged insights to make predictions about future stock performance, assisting in investment decision-making.
Impact of the Project:-
-
Provided actionable insights into stock performance, guiding investors on when to buy, sell, or hold.
-
Demonstrated how moving averages and predictive models can improve decision-making.
-
Built a robust foundation for future algorithmic trading and investment strategies by integrating statistical rigor and advanced visualizations.
Connect & Follow:
If you found my project insightful, I’d love to connect! I’m passionate about creating impactful data-driven solutions like this one to drive success. Follow me for more updates on my projects and insights. Let’s collaborate and grow together!
Data Scientist | Data Analyst | SEO Analyst

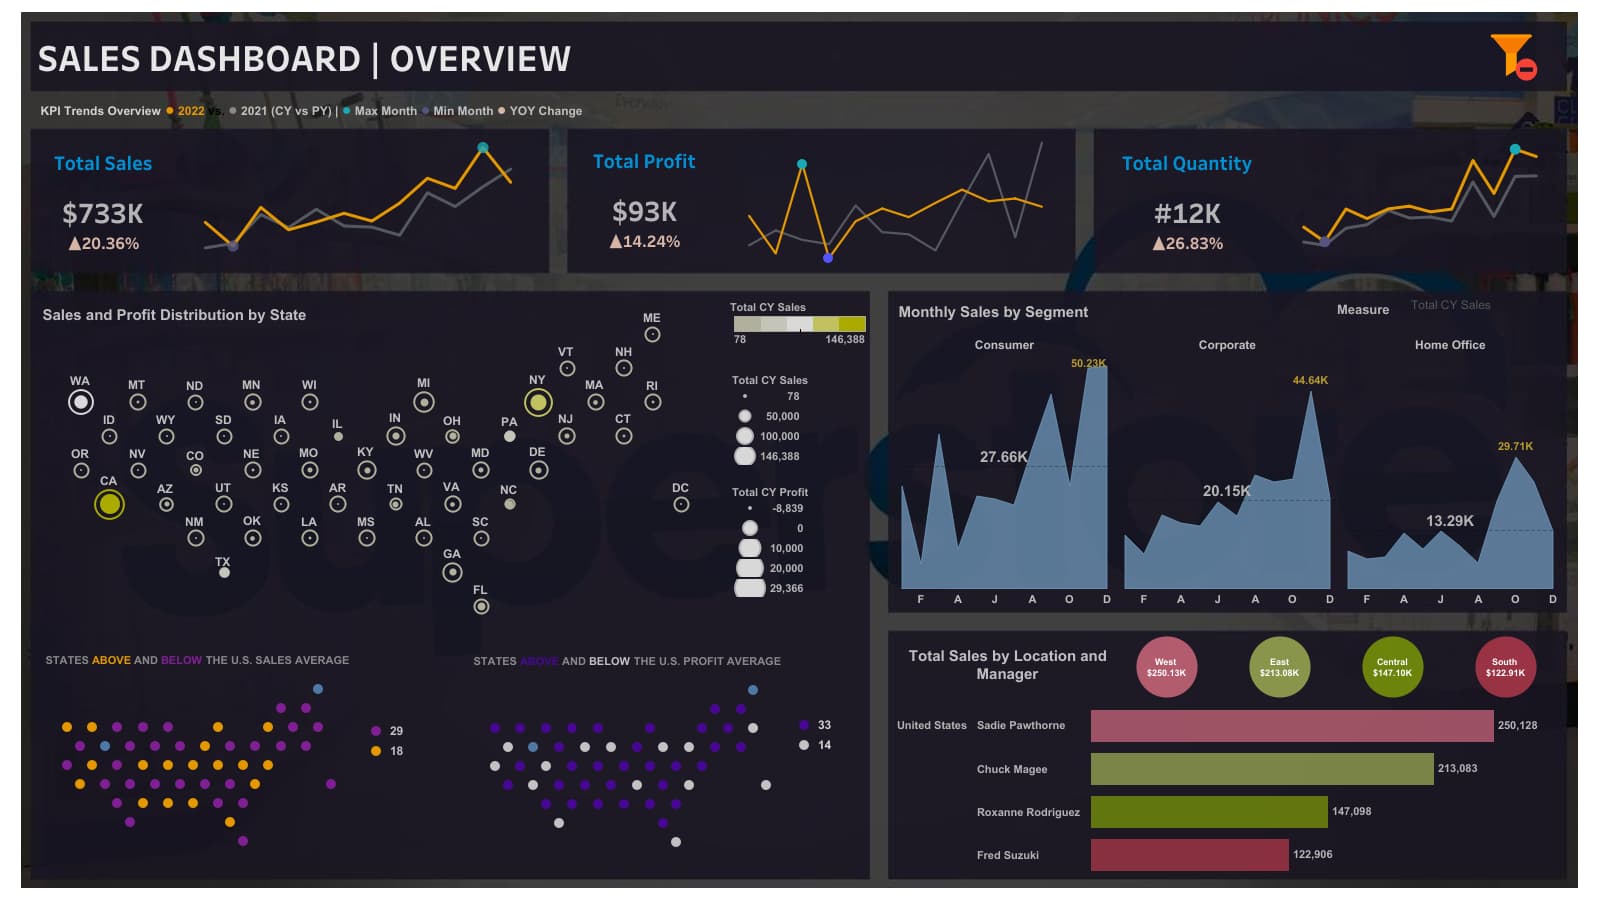
Sales Dashboard Overview with Tableau
Created an interactive Sales Dashboard using Tableau to deliver a comprehensive view of sales performance, including metrics such as sales, profit, and quantity. The dashboard features region-based visualizations for real-time insights, enabling trend tracking, key metric monitoring, and data-driven decision-making to enhance sales strategies.
Sales Dashboard Overview with Tableau
Business Domain: Retail
Developed an interactive Sales Dashboard using Tableau to provide real-time insights into sales performance across categories. Analyzed key metrics including total sales, profit, and quantity. Category-specific insights highlighted profitability trends, guiding strategic decisions to optimize revenue and improve operational efficiency.
View Project:  Tableau
 Linkedin
Tools Used:
 MS Excel |
Project Details:
Insights and Key Metrics:-
-
Overall Sales Performance: The dashboard provides a detailed view of total sales, amounting to $733K, broken down by category: Furniture ($215K), Office Supplies ($246K), and Technology ($272K). This breakdown helps to understand which categories contribute the most to the business’s revenue.
-
Profit Tracking: Total profit across all categories is $93K. Detailed profit insights by category show Furniture at $3K, Office Supplies at $40K, and Technology at $51K. These insights highlight the most profitable areas, guiding strategic decisions on inventory and pricing.
-
Quantity Analysis: The total quantity sold is 12K units, with category-specific breakdowns—Furniture: 2K, Office Supplies: 8K, and Technology: 2K. This metric provides insights into product demand and sales volume trends across different product types.
-
Trend Visualization: The interactive Tableau dashboard enables real-time monitoring of sales and profit trends, allowing users to explore visualizations like clustered bar charts, area charts, scatter plots and filled maps. This feature helps in identifying sales spikes, seasonal patterns, and areas requiring attention.
-
Actionable Insights for Decision-Making: The dashboard empowers stakeholders with actionable insights to make data-driven decisions. By tracking sales and profit trends, businesses can optimize their product mix, marketing strategies, and operational efforts to improve overall performance.
Conclusions:-
The Sales Dashboard provides a comprehensive overview of the company’s performance, revealing key insights into total sales, profits, and quantities across different categories. With total sales reaching $733K and total profit at $93K, the Technology category stands out as the most profitable, contributing $51K in profit, despite lower sales volume (2K units). Office Supplies also shows strong sales performance, contributing $246K in sales and $40K in profit. Furniture, although contributing $215K in sales, has the lowest profit of $3K, indicating potential challenges in profitability despite relatively high sales volume.
Recommendations:-
-
Focus on High-Profit Categories: Given the higher profitability of the Technology and Office Supplies categories, efforts should be directed towards enhancing these segments through targeted marketing and inventory optimization.
-
Evaluate Furniture Category: The Furniture category's high sales but low profit margin suggests a need to reassess pricing strategies or cost structure. Consider offering promotions or improving product margins through better supplier negotiations.
-
Adjust Sales Strategies Based on Quantity: With Office Supplies being the top performer in quantity sold, consider increasing stock levels for this category, while evaluating the potential for bundling or upselling products in Furniture and Technology to boost overall sales and profit.
-
Trend-Based Marketing: Utilize the trend analysis from the dashboard to drive seasonal campaigns or targeted promotions. For example, if technology products see a rise in demand during specific months, seasonal promotions can help capitalize on that spike.
-
Data-Driven Decision Making: Continue utilizing real-time data from the dashboard to monitor performance, identify emerging trends, and adjust sales tactics quickly. This data-driven approach will enable the business to stay agile and responsive to market dynamics.
Connect & Follow:
If you found my project insightful, I’d love to connect! I’m passionate about creating impactful data-driven solutions like this one to drive success. Follow me for more updates on my projects and insights. Let’s collaborate and grow together!
Data Scientist | Data Analyst | SEO Analyst
HR Data Analytics Dashboard with Tableau and MS PowerBI
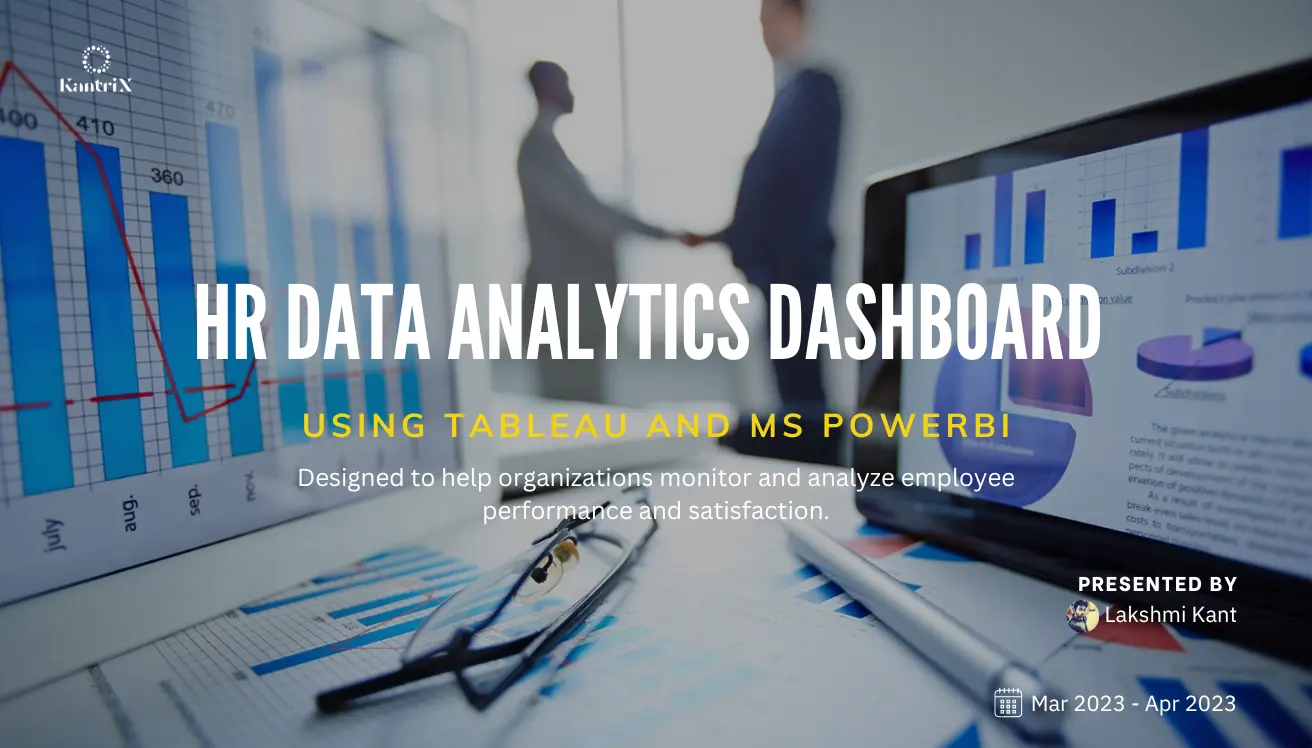
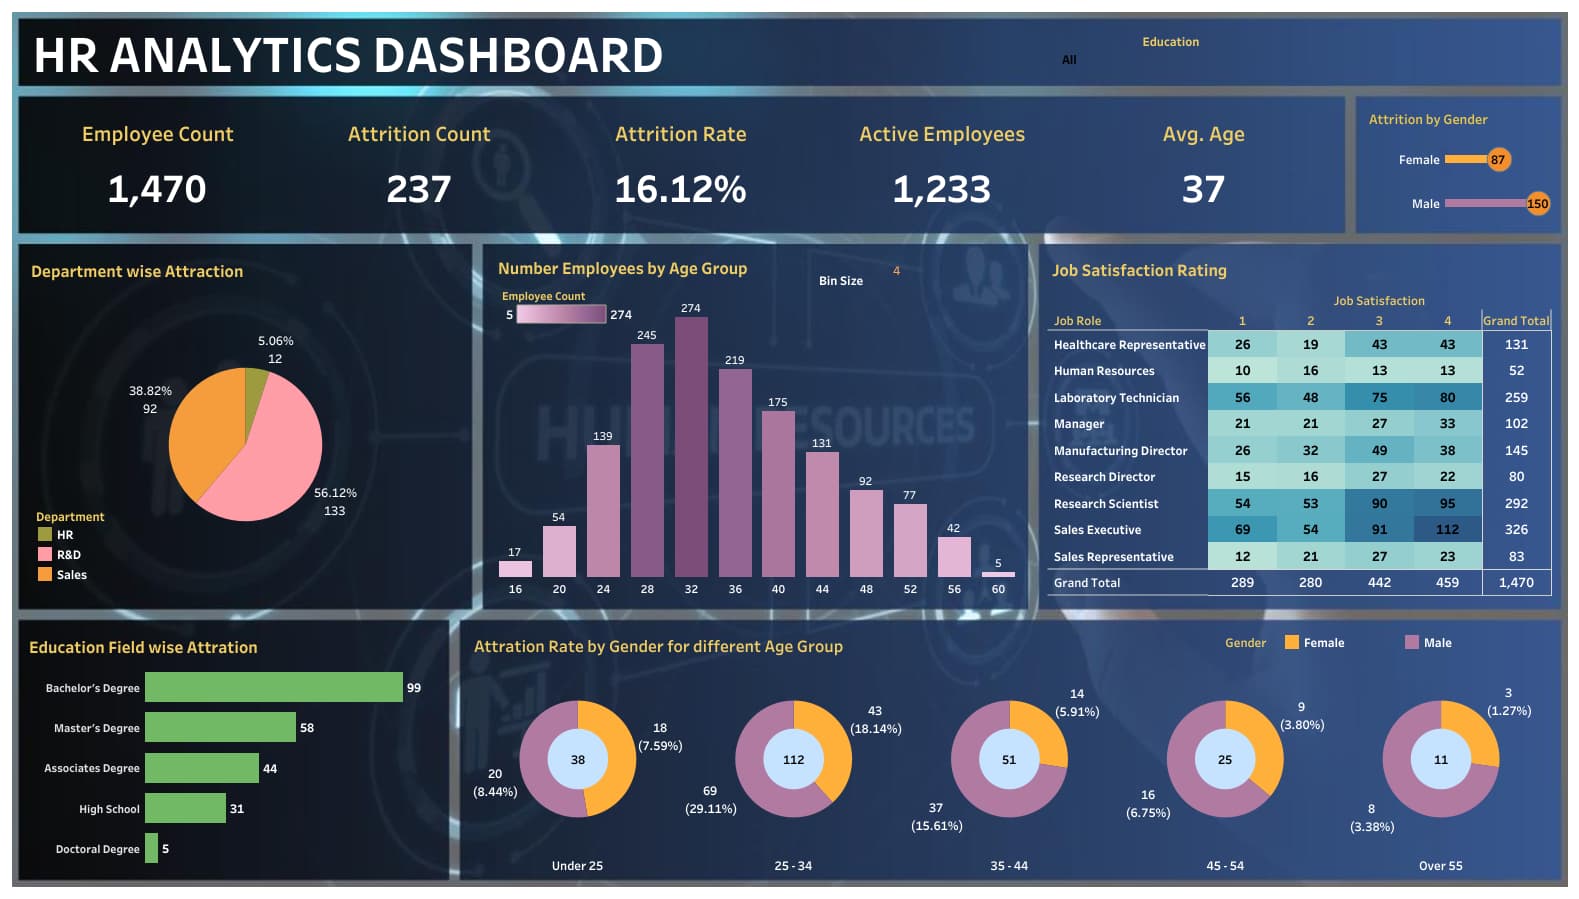
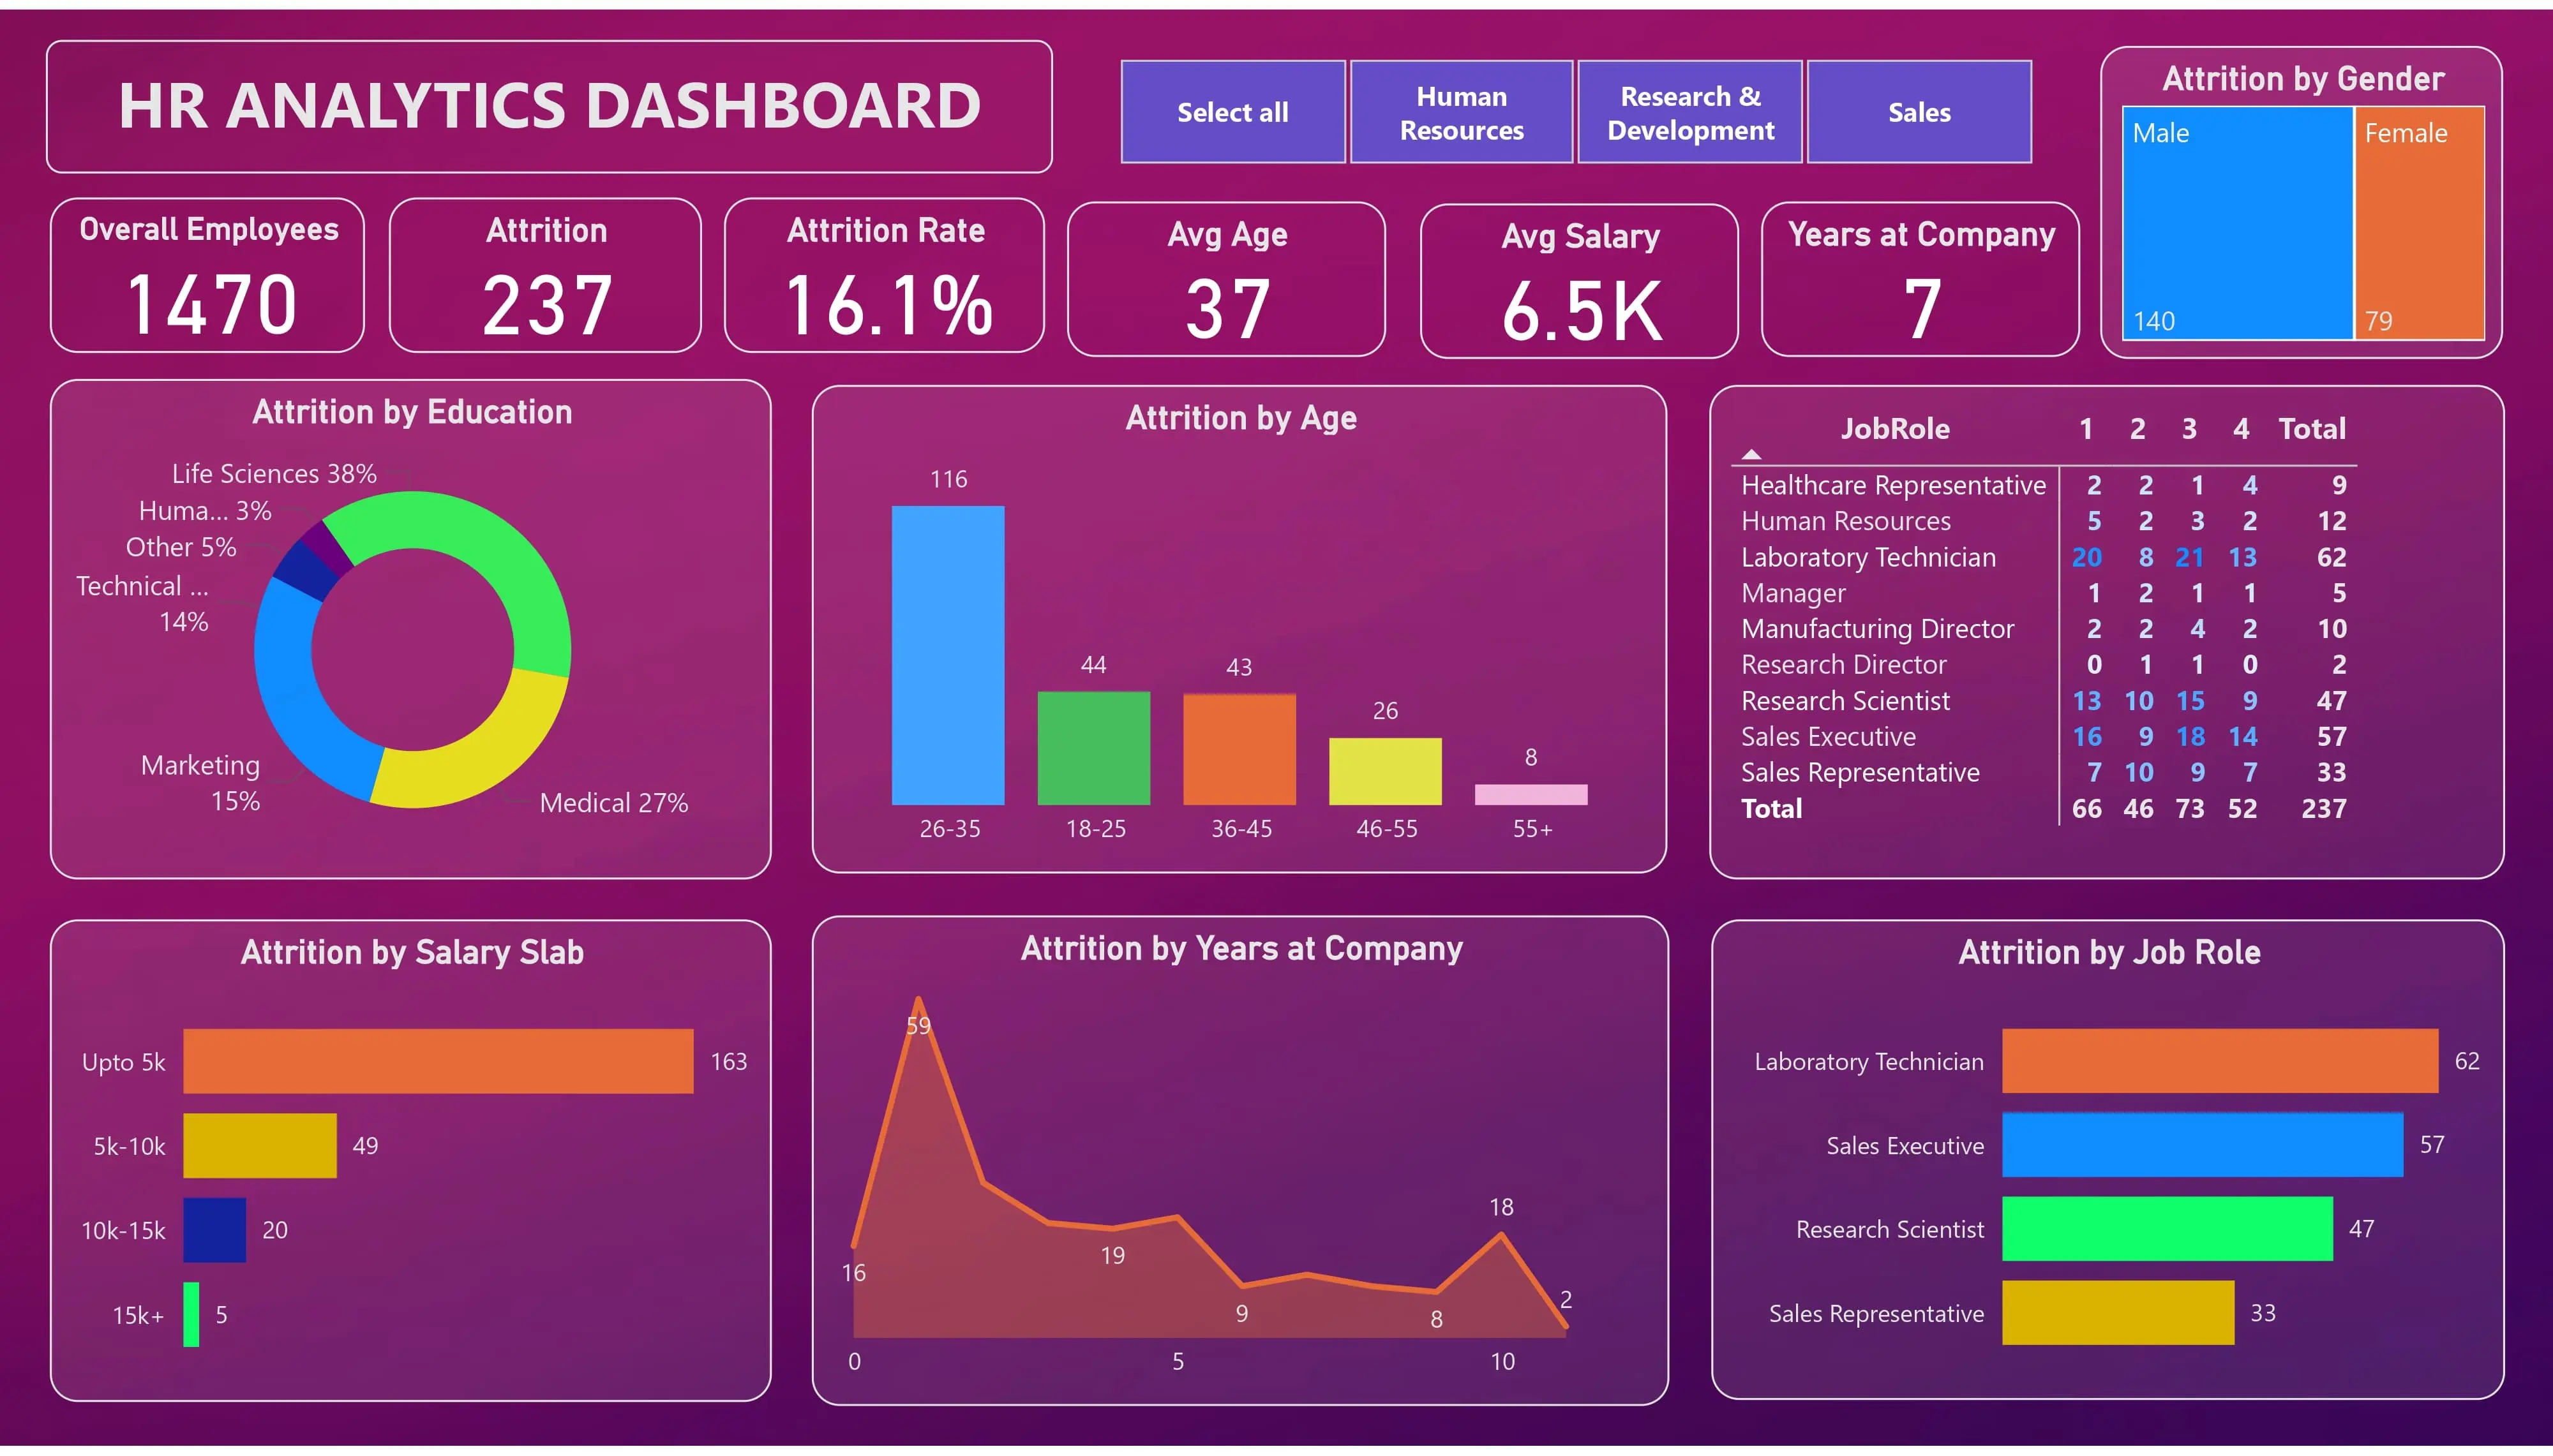
Developed an HR Data Analytics Dashboard using Tableau and MS Power BI to deliver real-time insights into workforce trends. Tracked key metrics like employee performance, retention, and engagement. Enabled data-driven decisions to optimize HR strategies and improve workforce management with powerful, actionable analytics.
HR Data Analytics Dashboard with Tableau and MS PowerBI
Business Domain: Human Resource
Designed to help organizations monitor and analyze employee performance and satisfaction. It enables the identification of trends and patterns, empowering businesses to make data-driven decisions that enhance employee engagement, improve retention rates, and drive overall organizational success.
View Project:  MS PowerBI
 Tableau
 Linkedin
Tools Used:
 MS Excel |
 MS PowerBI |
Project Details:
Insights and Key Metrics:-
-
Workforce Overview: Analyzed data for a total of 1,470 employees, including both active staff and those who left the organization. Key demographic insights include an average age of 37 years, providing a snapshot of the workforce composition.
-
Attrition Analysis: Identified 237 employee attritions, representing a 16.1% attrition rate. This metric helped spotlight turnover trends and areas requiring retention strategies.
-
Compensation Insights: The average monthly salary of $6,500 provided benchmarks for competitive pay structure analysis, aiding decisions on employee compensation and satisfaction.
-
Tenure Assessment: Employees stayed an average of 7 years, highlighting opportunities to reinforce long-term engagement and career development programs.
-
Active Employee Base: Of the total workforce, 1,233 employees remained active, forming the foundation for ongoing productivity and organizational continuity.
Conclusions:-
The analysis revealed key insights into workforce dynamics, including a moderate attrition rate of 16.1% and an average tenure of 7 years, which indicate room for improvement in employee retention. While the average salary of $6.5k aligns with competitive benchmarks, targeted efforts in compensation reviews and benefits enhancement could further boost employee satisfaction.
Recommendations:-
To address the attrition rate and foster engagement, organizations should prioritize the following:
-
Enhance Retention Strategies: Implement career development programs, mentorship opportunities, and regular employee feedback mechanisms to improve long-term engagement.
-
Strengthen Compensation Packages: Regularly benchmark salaries and benefits to stay competitive and address the financial motivations behind attrition.
-
Focus on Active Workforce Development: Invest in training and professional growth opportunities for the 1,233 active employees to build a resilient and motivated workforce.
-
Address Attrition Drivers: Conduct exit interviews to pinpoint specific reasons for employee turnover and implement actionable solutions to mitigate these issues.
Connect & Follow:
If you found my project insightful, I’d love to connect! I’m passionate about creating impactful data-driven solutions like this one to drive success. Follow me for more updates on my projects and insights. Let’s collaborate and grow together!
Data Scientist | Data Analyst | SEO Analyst
Cyclistic Case Study with R Programming
In this case study, conducted in-depth exploratory data analysis of Cyclistic's historical bike-share data using R programming, RStudio, and packages like tidyverse and dplyr. Performed data collection, cleaning, exploration, and visualization to uncover customer usage trends. Insights guided strategic decisions for market growth.
Cyclistic Case Study with R
Business Domain: Fictional and Bike-share
Examined Cyclistic's bike trip data to uncover trends and compare rental habits of annual members vs. casual riders. Used R, RStudio, and tools like tidyverse and dplyr for data cleaning, exploration, and visualization. Insights guided targeted marketing strategies. This project was my capstone for the Google Data Analytics Certificate.
View Project:  GitHub
 Linkedin
 Kaggle
Tools Used:
 RStudio |
Project Details:
Insights and Key Metrics:-
My Hypothesis: Members and casual riders differ fundamentally in purpose. Members are locals using bikes for commuting or errands, while casual riders are tourists using them for sightseeing. Converting casual riders into members may be challenging.
-
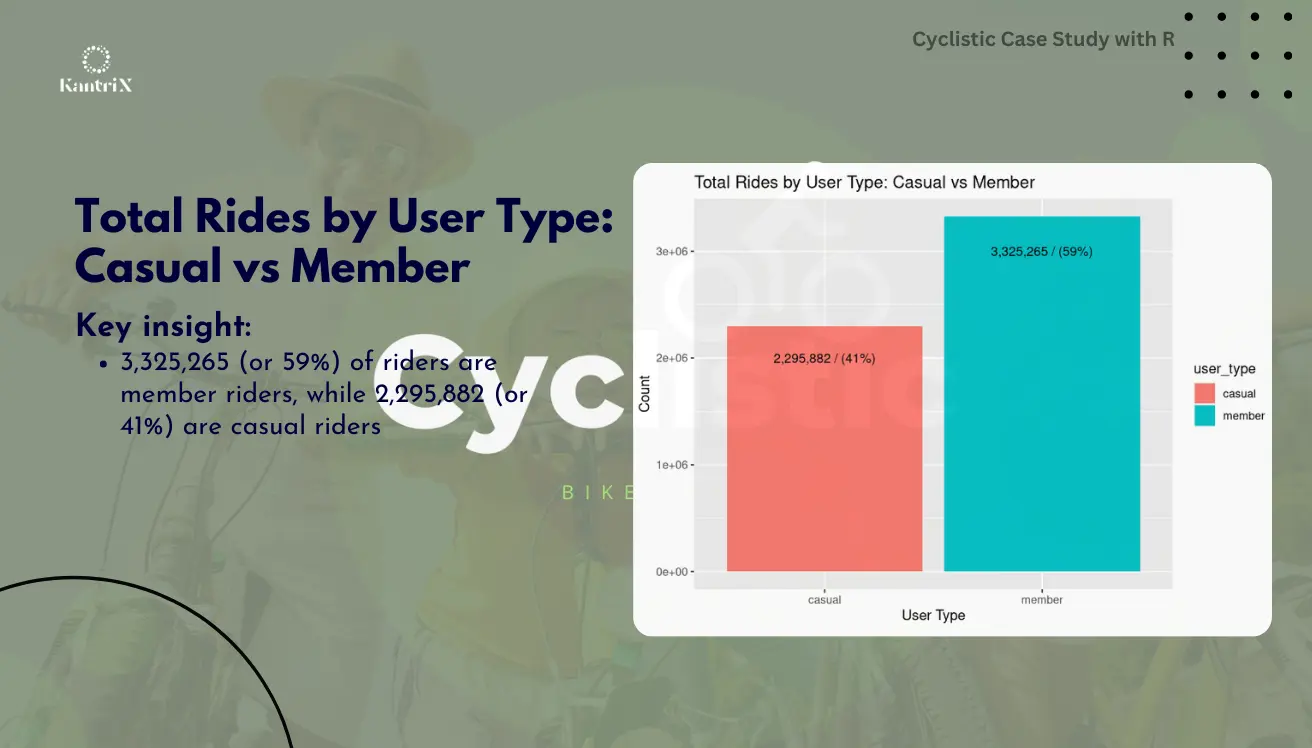
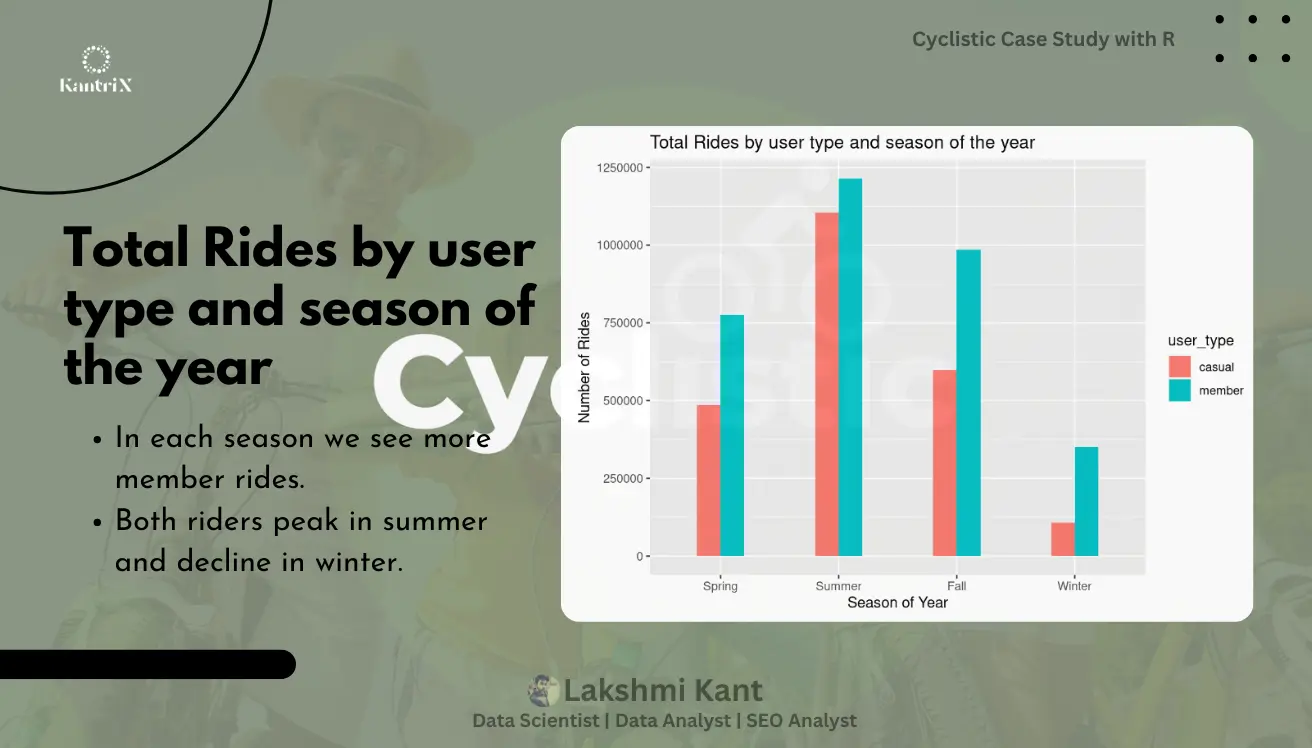
Rider Types & Trip Proportions: Annual members dominated usage, making up 57% of total trips, while casual riders accounted for 43%. This highlights a stronger commitment to bike-share services among members.
-
Average Ride Duration: Casual riders averaged 30 minutes per trip, suggesting leisurely or recreational rides. In contrast, members averaged just 13 minutes, reflecting a task-oriented or commuting purpose.
-
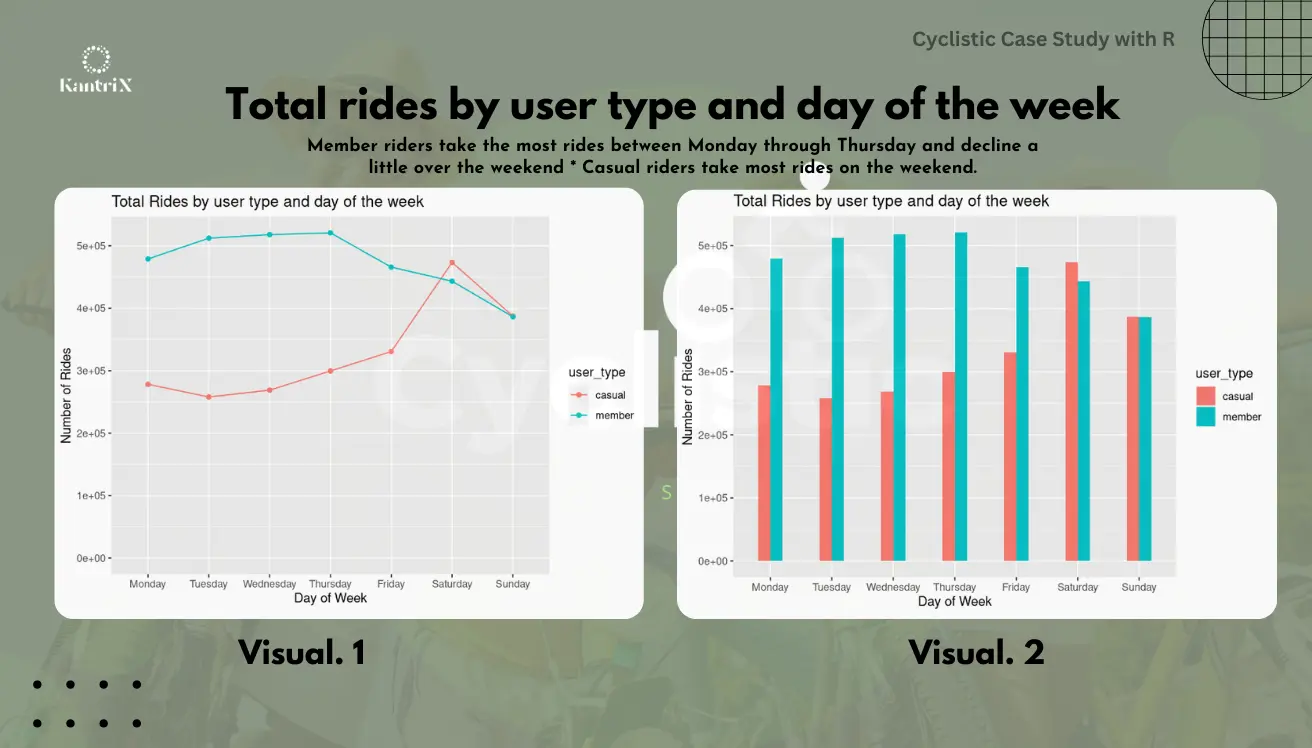
Peak Usage Times: The busiest time of day for both groups was around 5 PM, post-lunch hours. However, casual riders primarily used the service on weekends, while members used it consistently throughout the workweek.
-
Seasonal Usage Trends: Both groups peaked in usage during the summer, but members’ activity extended into October, aligning with Chicago’s commuter trends. Casual riders were more active in the core summer months of June, July, and August, likely for recreation and sightseeing.
-
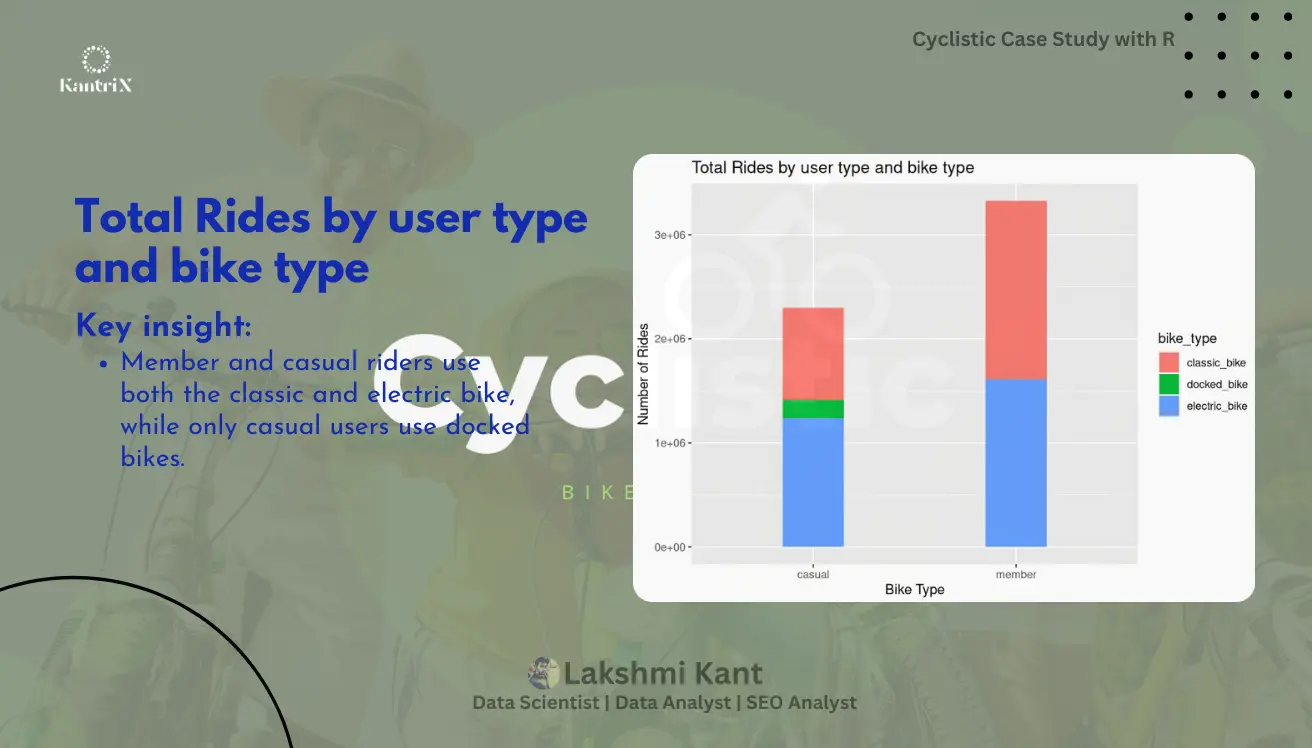
Bike Type Preferences: Classic bikes were favored by both groups, though electric bikes saw higher adoption among annual members, hinting at their preference for efficiency during commutes.
Conclusions and Recommendations:-
-
Distinct Rider Patterns: The analysis confirms that annual members and casual riders have fundamentally different riding behaviors. Members primarily use bikes for commuting or errands, evidenced by shorter ride durations and consistent weekday usage. Casual riders, on the other hand, favor weekend rides with longer durations, indicating leisure and recreational use.
-
Challenges in Converting Casual Riders: Casual riders are likely tourists or infrequent users, making it challenging to convert them into annual members. Their usage patterns suggest limited interest in regular, subscription-based services.
-
Targeted Marketing Strategies:
-
Focus membership campaigns on locals by emphasizing cost savings and convenience for daily commuting.
-
Introduce short-term membership options for tourists, such as week-long passes, bundled with sightseeing perks to attract casual riders.
-
Leverage Seasonal Trends: Increase marketing efforts during peak summer months to capture casual rider demand. Promote discounts or special events during shoulder seasons, like early fall, to extend usage into off-peak months.
-
Optimize Bike Fleet: With classic bikes being the most preferred, ensure adequate availability during peak hours. Expand electric bike inventory for members who prioritize efficiency during commutes, aligning with their weekday-focused usage patterns.
Connect & Follow:
If you found my project insightful, I’d love to connect! I’m passionate about creating impactful data-driven solutions like this one to drive success. Follow me for more updates on my projects and insights. Let’s collaborate and grow together!
Data Scientist | Data Analyst | SEO Analyst


Bellabeat Case Study with R Programming
Analyzed Bellabeat data using R programming to drive market strategy. Tasks included data collection, preparation, cleaning, exploratory analysis, and visualization. Delivered actionable insights on trends, user behavior, and engagement to guide data-driven decisions for enhanced product and marketing strategies.
Bellabeat Case Study with R
Business Domain: Wellness and Fitness
In this study, performed Bellabeat's smart device data to understand consumer usage patterns, providing actionable insights to shape the company's marketing strategy. Tasks included data preparation, cleaning, exploration, and visualization using R programming.
View Project:  Kaggle
 GitHub
 Linkedin
Tools Used:
Project Details:
Insights and Key Metrics:-
-
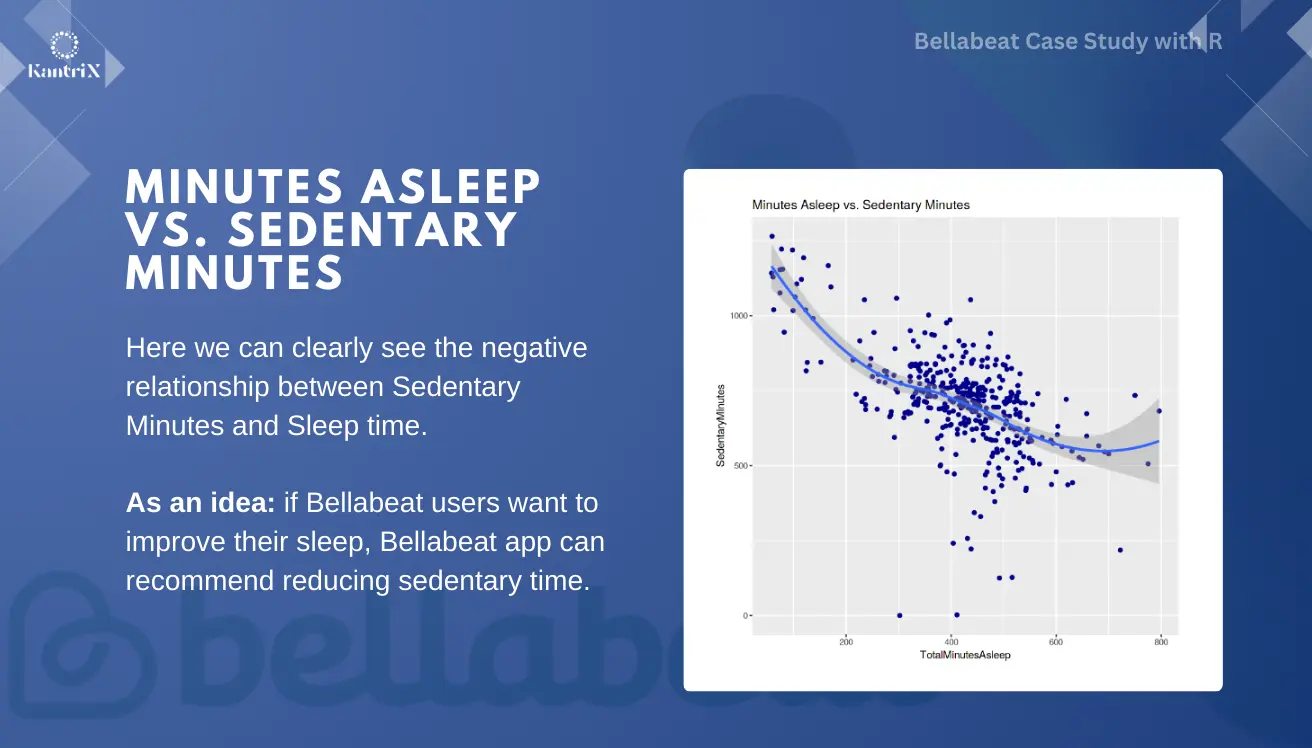
Sedentary Time: Average sedentary time exceeds 16 hours/day, indicating a need for a marketing strategy that encourages users to be more active. Target campaigns to users with high sedentary behavior, promoting easy activities like walking.
-
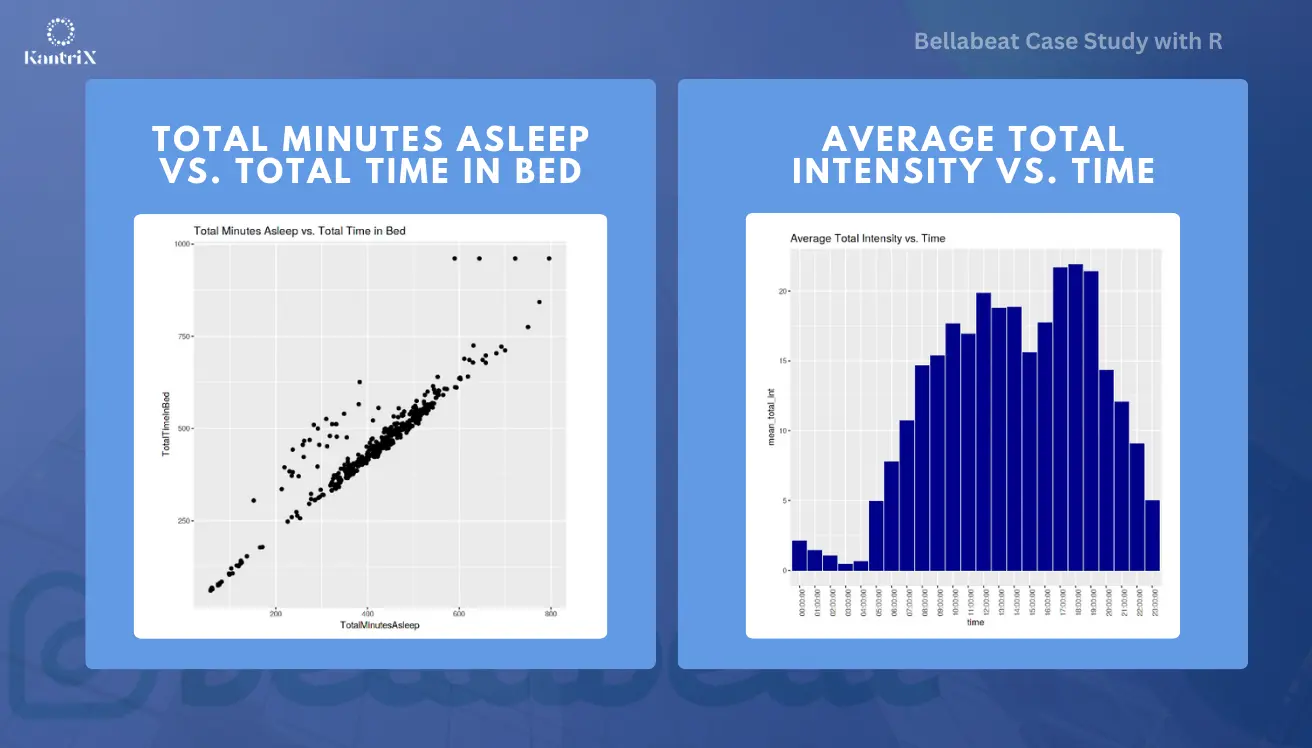
Sleep Patterns: Users sleep an average of 7 hours/night. Bellabeat can improve user well-being by incorporating bedtime reminders and suggestions to reduce sedentary time, helping users achieve better sleep and overall health.
-
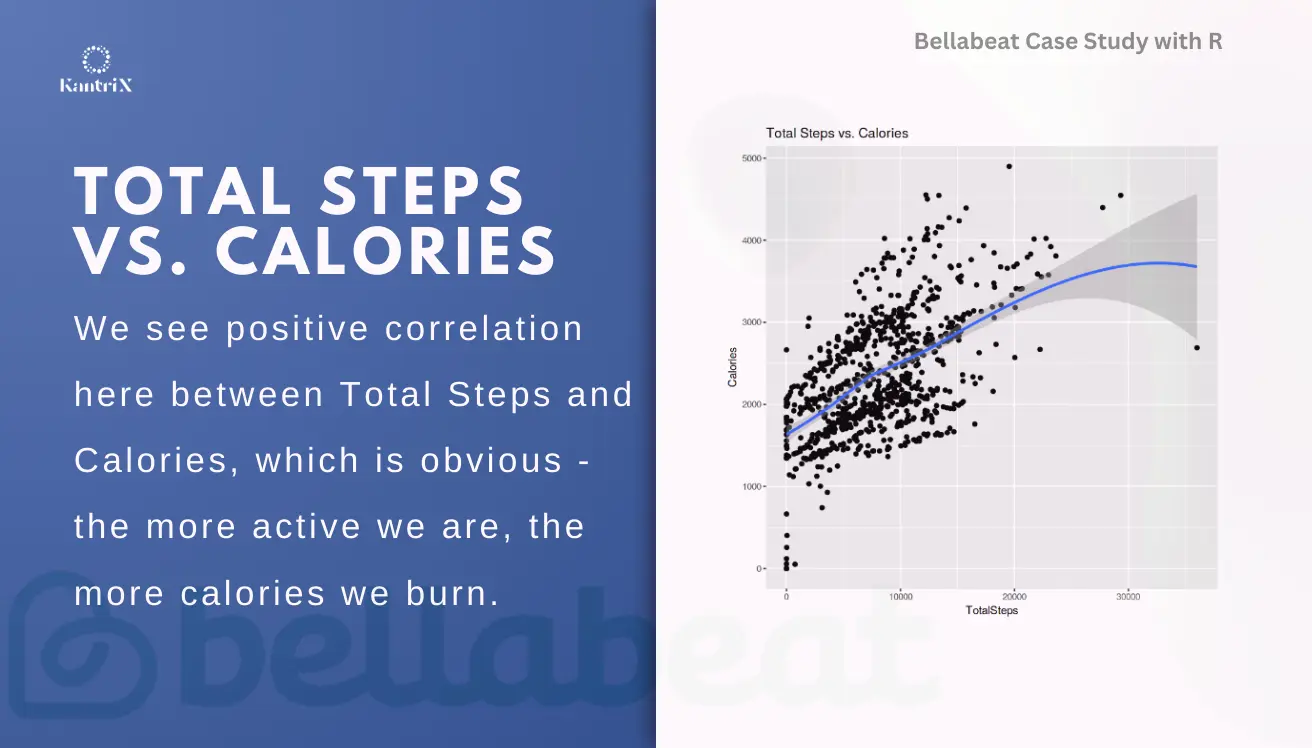
Daily Steps: Average daily steps are 7,638, slightly under the CDC's recommended 8,000 steps for optimal health. Encourage users to reach this target through notifications or challenges to improve their physical fitness and lower health risks.
-
Activity Intensity: Activity peaks before and after work hours. Bellabeat can utilize these time frames for personalized notifications, motivating users to engage in physical activities like walking or running during their routine.
-
Calorie Control for Weight Loss: Users aiming to lose weight can benefit from tracking calorie intake. Bellabeat can incorporate personalized meal suggestions with healthy, low-calorie options to help users manage their diet along with fitness.
Conclusions and Recommendations:-
-
Expand Data Collection: Focus on gathering data related to activity, sleep, and stress patterns to provide users with actionable insights into their health and daily habits. This will position Bellabeat as a personalized wellness advisor.
-
Target Audience Identification:
-
Focus on individuals with full-time jobs, particularly those spending long hours at desks or in office settings.
-
Cater to users who prioritize light physical activity but may need encouragement to increase their activity levels for greater health benefits.
-
Promote Light Activity Benefits: Educate users on the health benefits of transitioning from light to moderate activity levels. Offer personalized plans and motivational tools to encourage gradual increases in physical activity.
-
Encourage Healthy Habits: Provide resources, challenges, and reminders to help users develop and maintain healthier habits, such as regular exercise, proper sleep, and stress management.
-
Marketing Strategies: Highlight how Bellabeat devices can help users track, analyze, and improve their health through actionable data.
Connect & Follow:
If you found my project insightful, I’d love to connect! I’m passionate about creating impactful data-driven solutions like this one to drive success. Follow me for more updates on my projects and insights. Let’s collaborate and grow together!
Data Scientist | Data Analyst | SEO Analyst
Experience
Data Analyst
As a Data Analyst: analyzed marketing datasets to improve campaign performance and boost website traf...fic using Google Analytics. Leveraged Excel, SQL, and Python to deliver data-driven insights, enabling strategic business decisions. Built interactive Power BI dashboards for visualizing key metrics, enhancing reporting efficiency. Monitored KPIs to identify trends, driving ROI and business growth.
Data Analyst Trainee
As a Data Analyst Trainee: worked with diverse data sources and tools like Excel, SQL, Python, Jupyter Note...books, and Cognos Analytics. Gained hands-on experience in data manipulation and analysis, particularly in the healthcare sector. My role involved optimizing business operations, communicating insights through data visualizations, and preparing detailed reports for decision-making.
SEO Executive
As an SEO Executive: improving the websites of clients to increase web traffic. and focus on keyword research, limit...ing the repetition of content and building links. Also, spearheaded effective keyword research and optimization strategies, driving a remarkable 35% increase in organic website traffic. Also, and monitored website performance using diverse analytical tools and delivered reports to stakeholders for informed decision-making.
Associate Data Scientist
As an Associate Data Scientist: collect and analyze data on sales, marketing, or other behaviors. bring technical exper...tise to ensure the quality and accuracy of that data, then process, analyze, visualize, and present it in ways to help businesses and organizations make better decisions. I am also, working with the Digital and Sales Marketing team: leveraged Python and A/B testing techniques to enhance marketing campaign performance.
Qualification
College - Bachelor of Technology (BTech)
Chaitanya Institute of Technology and Science, Warangal, INChaitanya – Deemed to be University, Warangal
College Summary :
-
Studied core subjects of ME including Engineering Mathematics, Mechatronics, Structural Analysis, Computer Integrated Manufacturing (CIM), Computer-Aided Design (CAD), Computer-Aided Manufacturing (CAM), and Electricity.
-
Used of CAD software like AutoCAD, or CATIA to design mechanical components. Also, Programming knowledge (C/C++, Python, etc.) used for automating simulations, running complex calculations, and controlling mechanical systems.
-
Analyzed experimental data from various mechanical systems, providing insights into performance and areas for improvement.
-
Generated technical reports, research papers, and presentations for academic and professional purposes.
Class 12th - Intermediate of Science (ISc)
Maharaja College, Ara, Bihar, INVeer Kunwar Singh University, Ara
Class 12th Summary :
-
Subjects studied (PCM): Physics, Chemistry, Maths, English, Statistics , Hindi.
-
A strong foundation in the subject, develop their critical thinking and problem-solving skills, and prepare them for higher education and careers that require mathematical skills. Such as Vector, Algebra, Calculus, Integrals, Matrices, Linear Programming, Statatics & Probability.
IBM Data Analyst
IBM Skills Network TeamCoursera
IBM Data Analyst Summary :
-
Proficient in utilizing advanced analytics tools and techniques to analyze complex datasets, derive actionable insights, and support data-driven decision-making.
-
Skill in using IBM's suite of data analytics tools, including IBM Cognos, SPSS, IBM Cloud, and Watson Analytics, as well as programming languages like SQL, and Python for data manipulation and analysis.
-
Experience in creating comprehensive reports and dashboards that communicate findings effectively to stakeholders, helping to guide strategic planning and operational improvements.
-
Adept at identifying trends, patterns, and anomalies within data sets, and applying problem-solving skills to address business challenges and optimize processes.
Google Data Analytics
Google Career CertificatesCoursera
Data Analytics Summary :
-
Included hands-on, practice-based assessments and are designed to prepared for Entry-level roles in Data Analytics; competent in tools and platforms including spreadsheets, SQL, Tableau, and R: know how to prepare, process, analyze, and share data for thoughtful action
-
A deep understanding of data analysis techniques, including data collection, cleaning, and visualization.
-
Visualized and presented data findings in dashboards, presentations and commonly used visualization platforms.
-
I used data to make informed decisions, which is crucial for driving business strategies and improving organizational outcomes.
Contact Me
If you like my work and want to avail my services then drop me a message using the contact form.
Or get in touch using my email, skype or my contact number.
See you!
